Amortization Schedule
Discover how an amortization schedule works in Canadian real estate and why it matters for mortgage transparency and long-term financial planning.

May 22, 2025
What is an Amortization Schedule?
An amortization schedule is a detailed table showing how a mortgage loan is repaid over time through regular payments, breaking down each payment into principal and interest.
Why Amortization Schedules Matter in Real Estate
An amortization schedule helps borrowers understand how their loan balance decreases over time. It outlines each scheduled payment, how much goes toward the loan’s principal, how much goes toward interest, and the remaining balance after each payment.
For homeowners, this tool provides transparency and helps with financial planning. Early in the amortization period, a larger portion of payments goes toward interest. As time progresses, more of each payment is applied to the principal. This pattern is crucial for understanding equity buildup, refinancing potential, and how prepayments affect the total cost of borrowing.
In Canada, most lenders provide an amortization schedule upon mortgage approval or request. It is particularly useful when comparing fixed-rate vs. variable-rate mortgages or evaluating the benefits of making lump-sum prepayments.
Example of an Amortization Schedule
A borrower with a 25-year mortgage receives an amortization schedule that shows each monthly payment of $2,200, with breakdowns illustrating how the loan is paid off over time.
Key Takeaways
- Shows how mortgage payments are divided between principal and interest.
- Helps track loan balance, equity buildup, and interest paid.
- Early payments are interest-heavy; later payments build principal.
- Useful for prepayment and refinancing planning.
- Provided by lenders to aid financial clarity.
Related Terms
- Amortization Period
- Mortgage Pre-Approval
- Interest Rate
- Fixed Rate Mortgage
- Prepayment Penalty

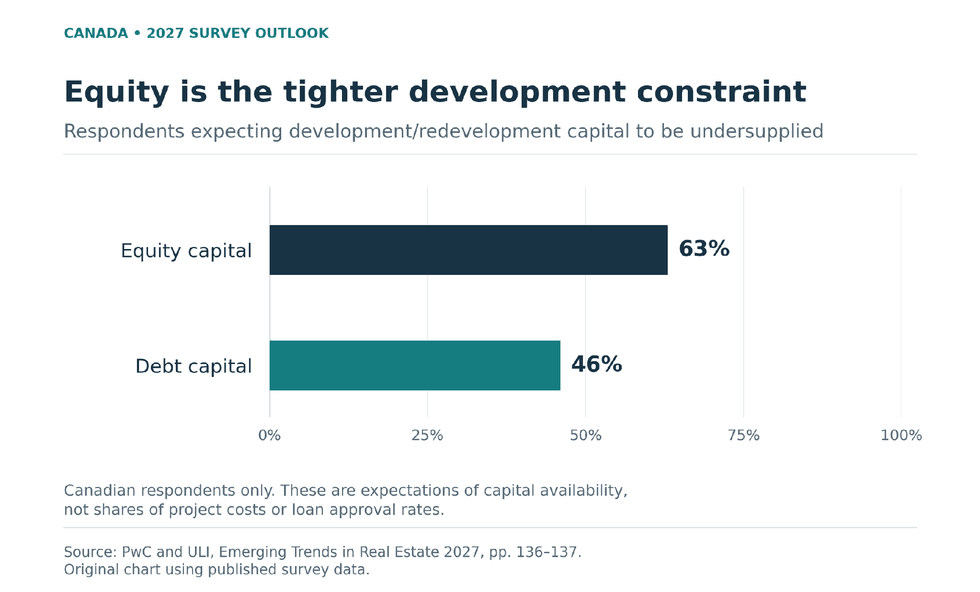 Canadian respondents were more likely to expect an undersupply of development/redevelopment equity capital (63%) than debt capital (46%) in 2027. These are survey expectations, not measured financing volumes. Source: PwC and ULI, Emerging Trends in Real Estate 2027, pp. 136–137. Original chart.
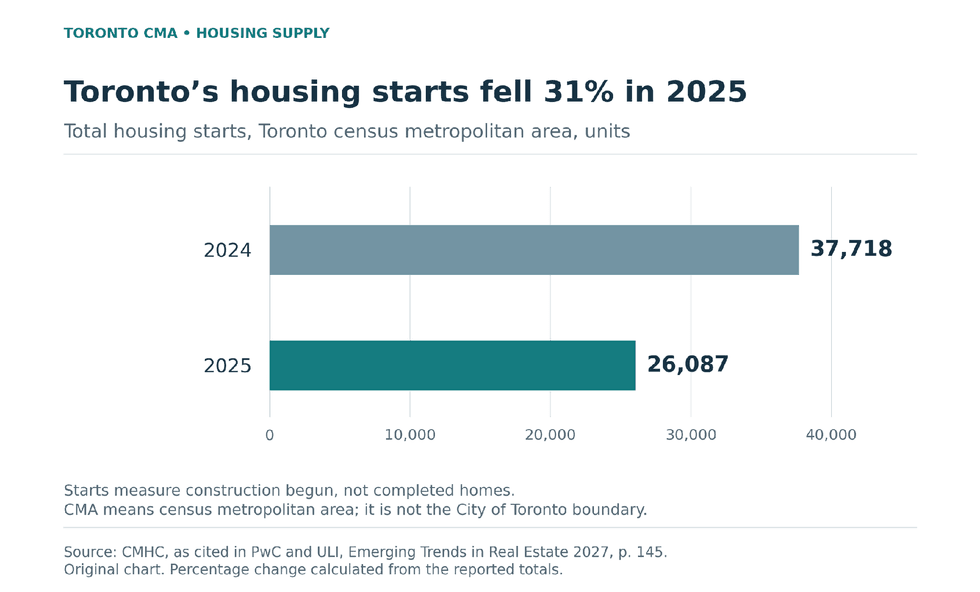 Toronto census metropolitan area housing starts fell from 37,718 units in 2024 to 26,087 in 2025, a 30.8% decline (rounded to 31%). Starts measure construction begun, not completed homes. Source: CMHC, as cited in PwC and ULI, Emerging Trends in Real Estate 2027, p. 145. Original chart.

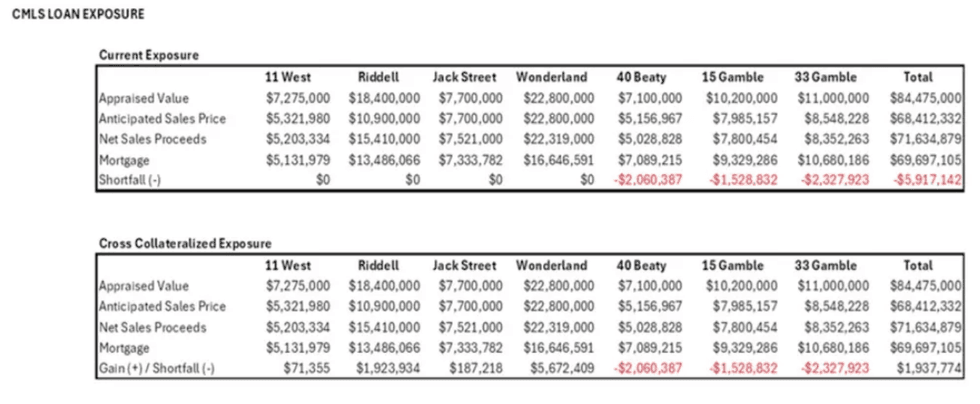








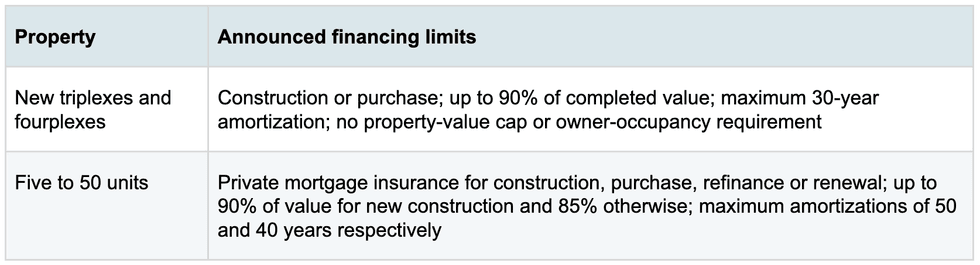
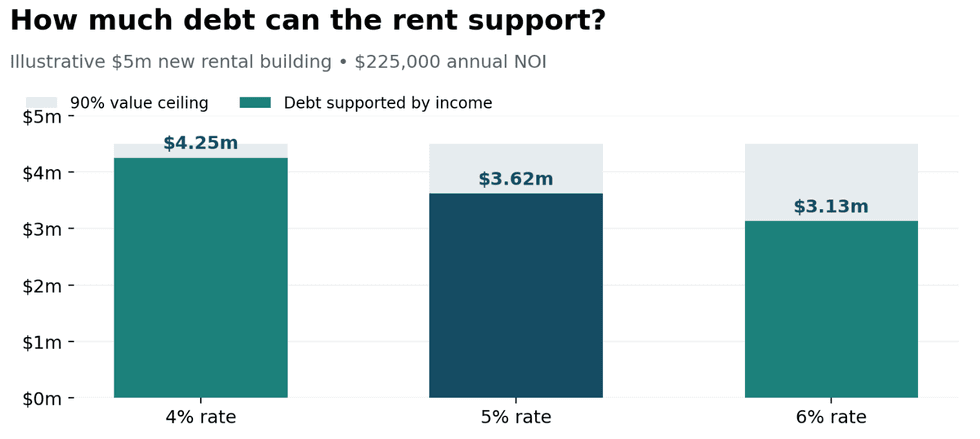 Illustrative calculation: a $4.5-million value ceiling versus income-based capacity of about $4.25 million at 4%, $3.62 million at 5% and $3.13 million at 6%. Assumes 50-year amortization and 1.15 debt coverage.
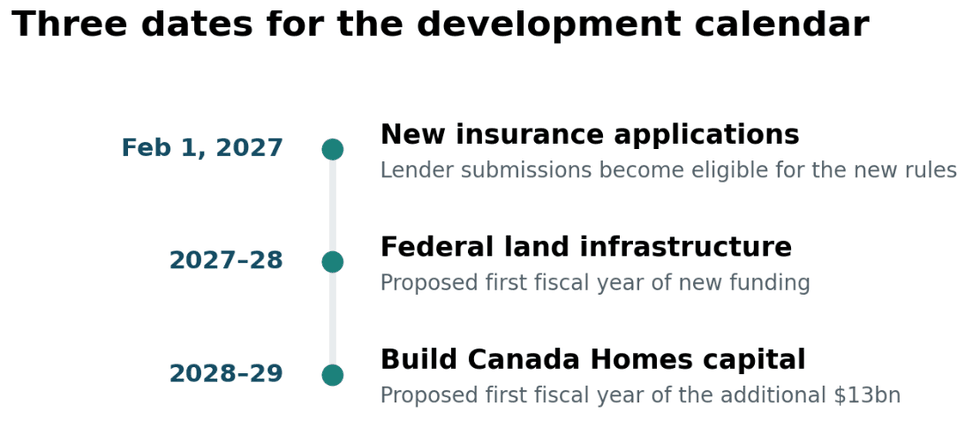 Source: Department of Finance missing-middle backgrounder and Budget 2026 Chapter 3, November 5, 2026. Fiscal-year funding starts are not home-completion dates.