Amortization Period
Learn what the amortization period means in Canadian real estate and how it affects mortgage payments, affordability, and long-term debt strategy.

May 22, 2025
What is an Amortization Period?
The amortization period is the total length of time it will take to fully pay off a mortgage loan through regular payments, typically expressed in years.
Why an Amortization Period Matters in Real Estate
In Canadian real estate, the amortization period plays a key role in determining a borrower’s monthly mortgage payment and the total interest paid over the life of the loan. A longer amortization period results in lower monthly payments but higher overall interest costs, while a shorter period leads to higher payments but faster equity buildup and lower interest paid.
Most insured mortgages in Canada are capped at a 25-year amortization, though uninsured mortgages can extend up to 30 or 35 years, depending on the lender. Lenders often combine the amortization period with shorter mortgage terms (e.g., 5 years), after which borrowers must renew their mortgage under potentially different rates and conditions.
Choosing the right amortization period depends on a buyer’s financial goals, risk tolerance, and income stability. First-time buyers might favour longer periods for affordability, while seasoned investors may opt for shorter durations to reduce debt quickly.
Example of an Amortization Period
A buyer takes a $500,000 mortgage with a 25-year amortization. Their payments are calculated to fully repay the loan over 25 years, assuming the interest rate and payment schedule remain consistent.
Key Takeaways
- Amortization refers to the total life of a mortgage loan.
- Longer periods mean smaller monthly payments but more interest.
- Shorter periods cost more monthly but build equity faster.
- Common amortization in Canada is 25 years for insured loans.
- Impacts budgeting, refinancing, and long-term affordability.
Related Terms
- Mortgage Term
- Interest Rate
- Loan-to-Value Ratio (LTV)
- Refinance
- Fixed Rate Mortgage
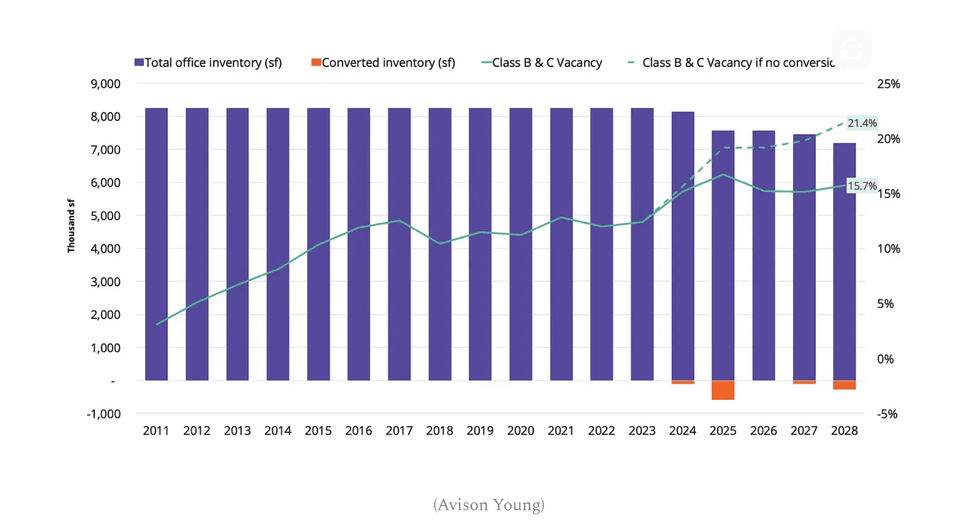 (Avison Young)
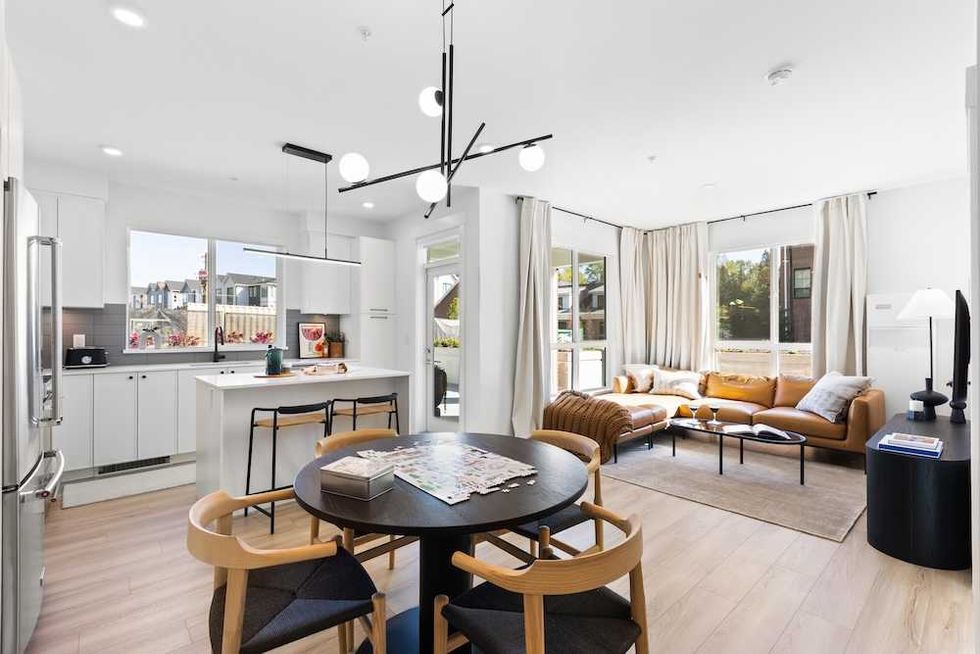 The Mason Suite Interior (Infinity Properties)
 The Mason Suite Interior (Infinity Properties)
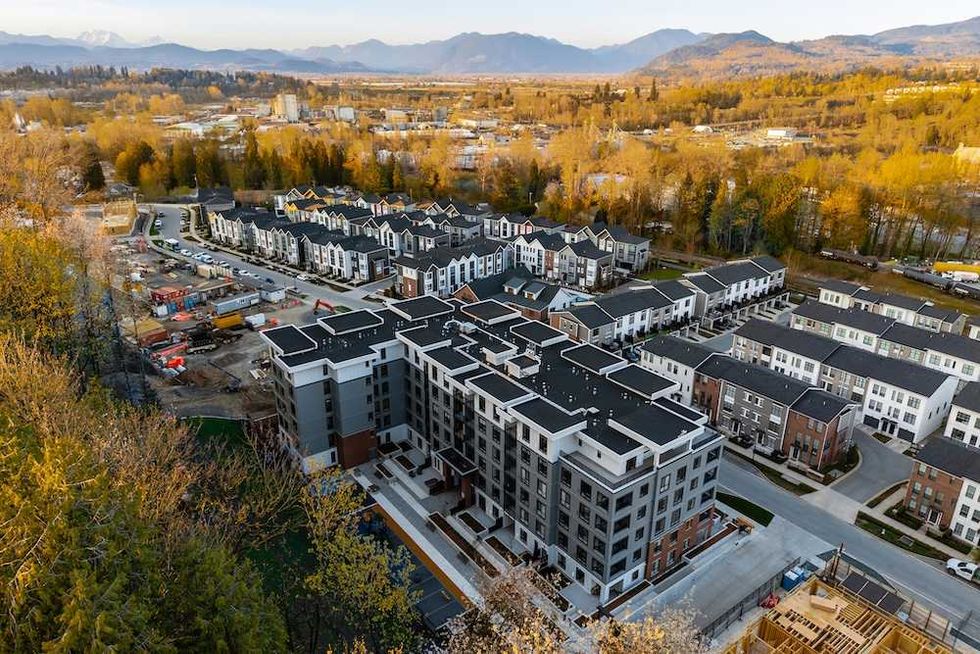 Rail District aerial (Infinity Properties)
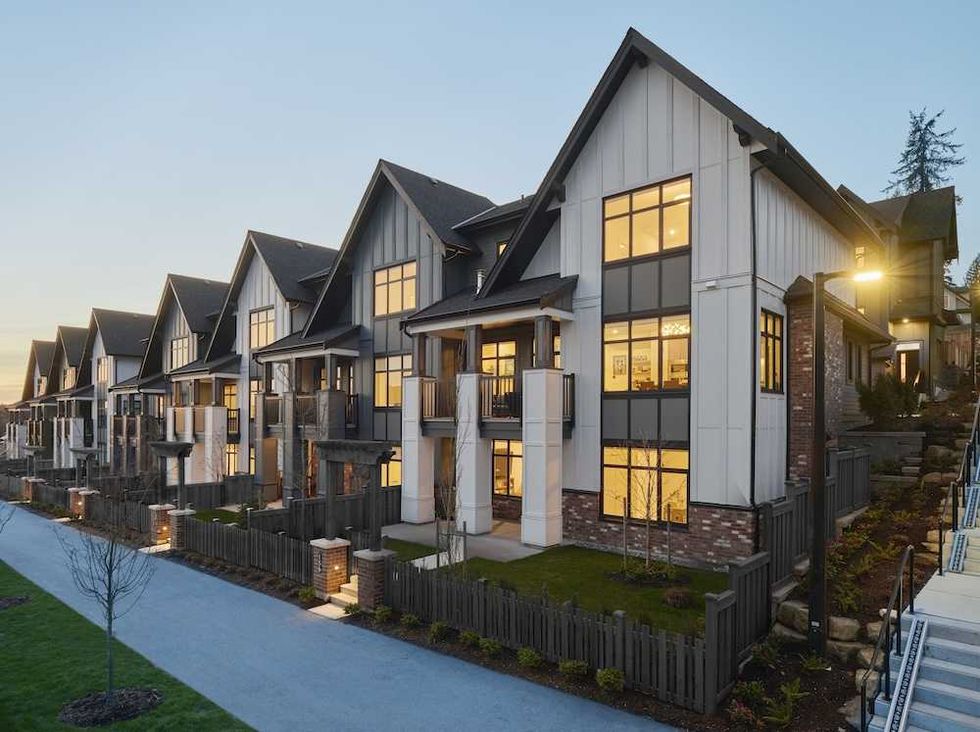 Versant (Infinity Properties)





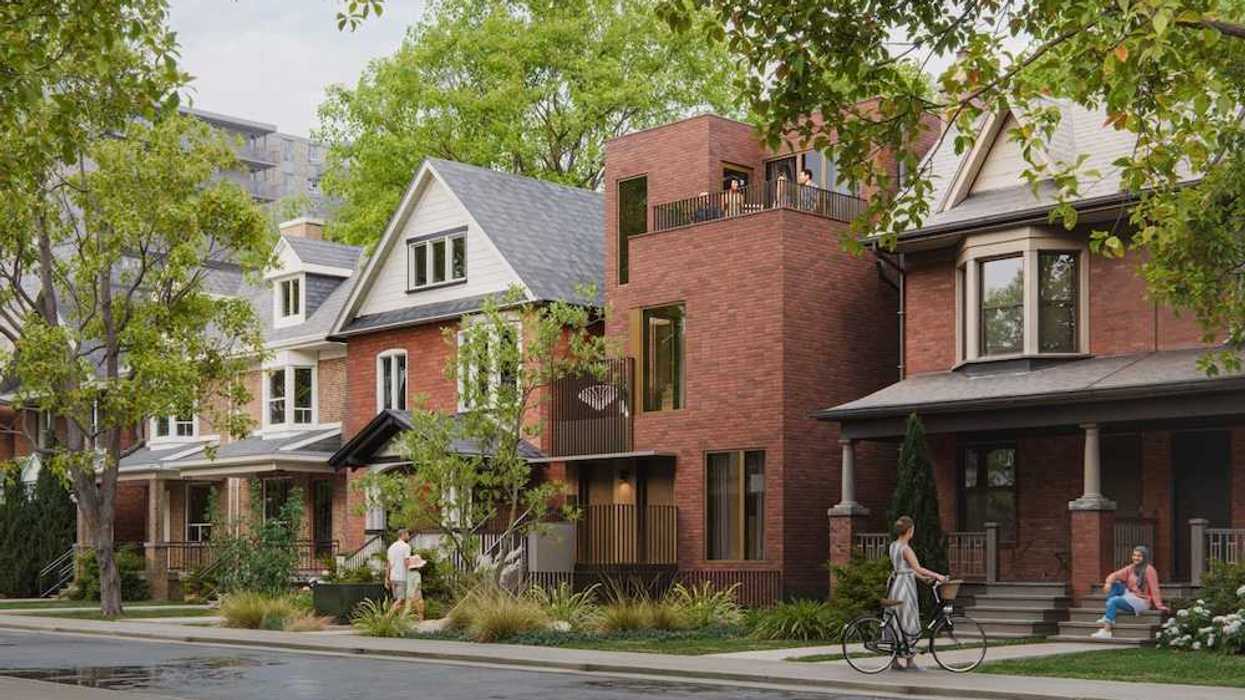
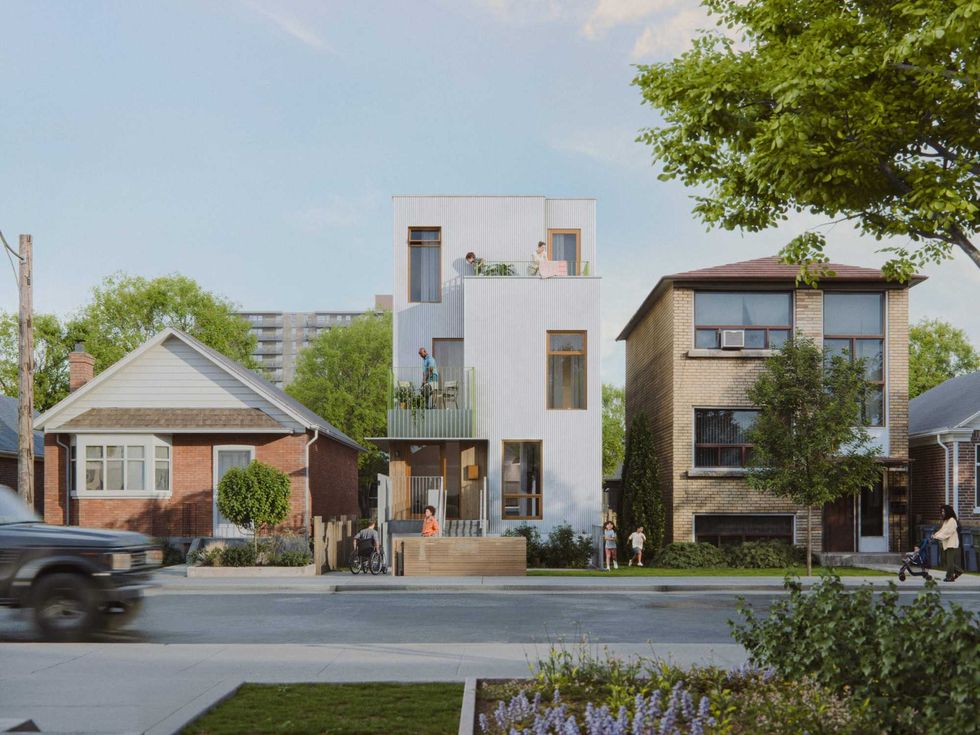 Narrow Fourplex (City of Toronto)
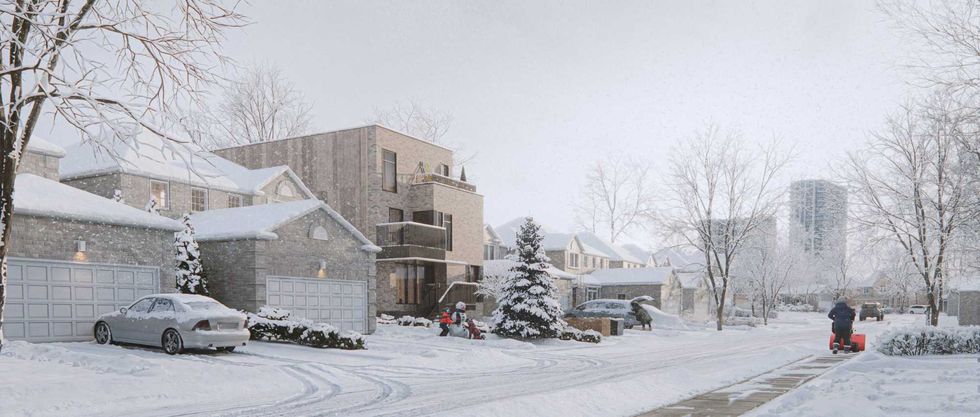 Wide Sixplex - Side View (City of Toronto)
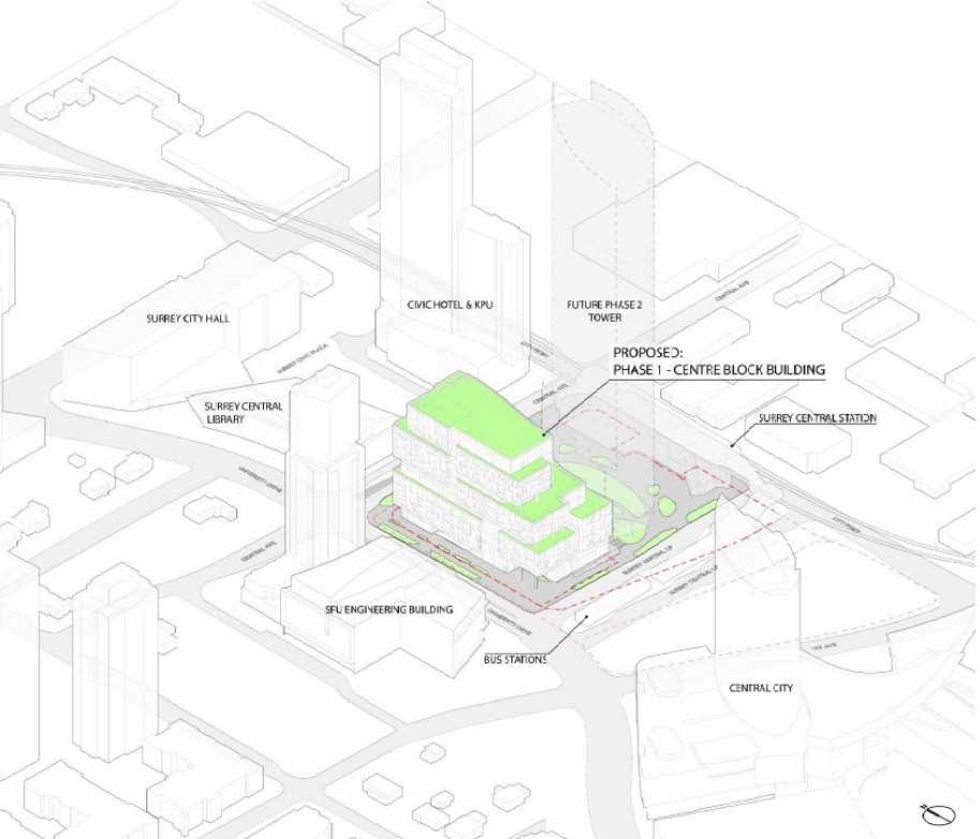 Centre Block and its surrounding context. (Stantec-Revery, SCDC)
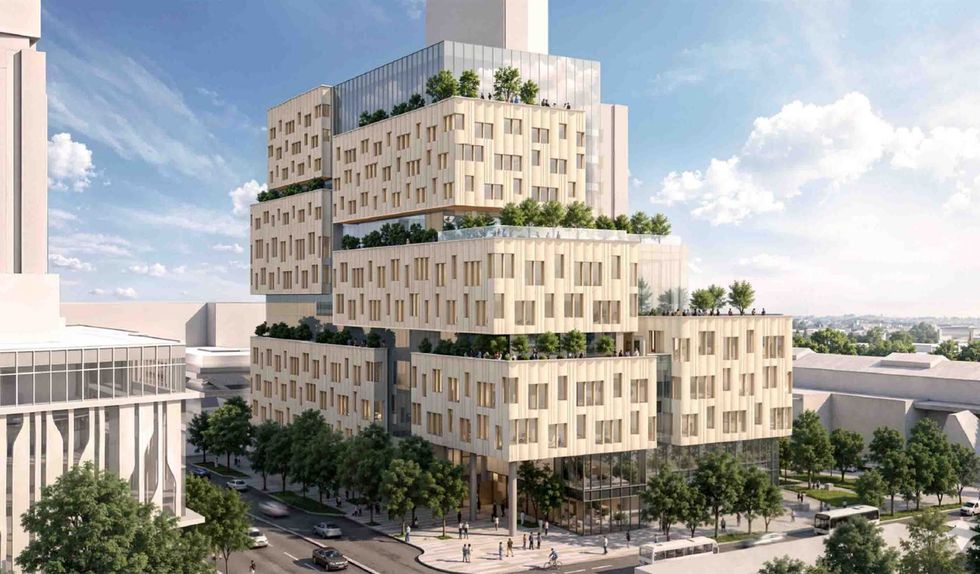 The 12-storey Phase One of Centre Block. (Stantec-Revery, SCDC)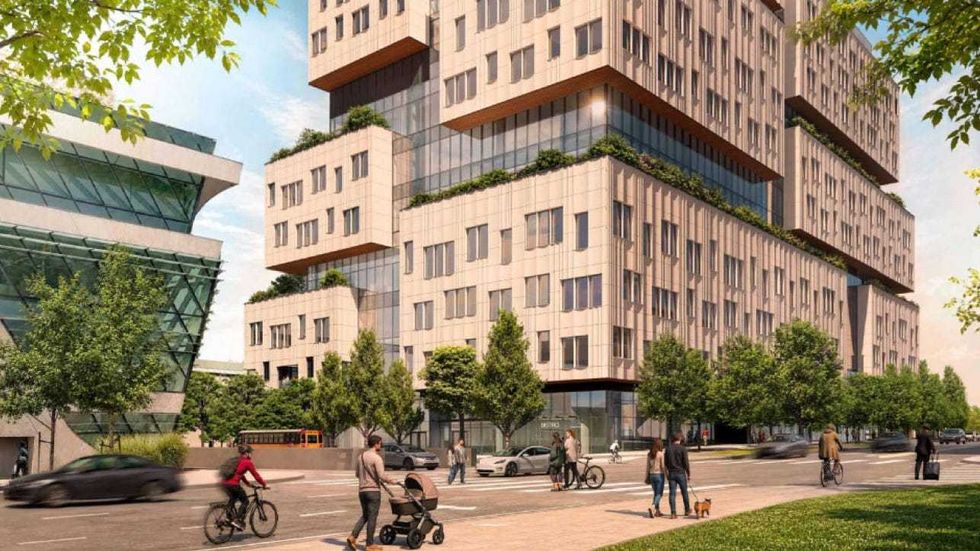
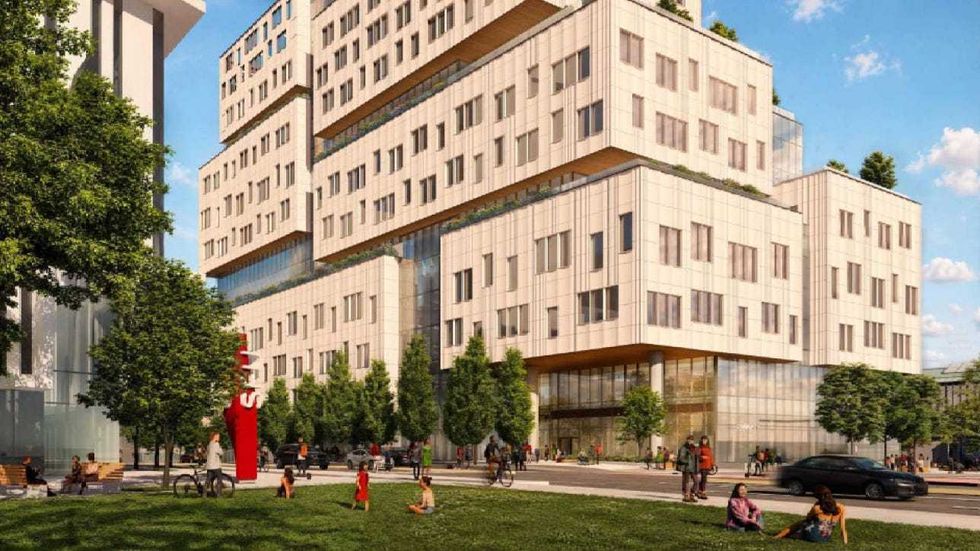 The 12-storey Phase One of Centre Block. (Stantec-Revery, SCDC)
 Mondria One, set for 1607 King Street East in Clarington, Ontario. (ICON Architects Inc., Monde Development Group)