Debt Coverage Ratio
Understand the debt coverage ratio (DCR) in Canadian real estate — what it measures, why it matters, and how lenders use it.

August 08, 2025
What is the Debt Coverage Ratio?
The debt coverage ratio (DCR) measures a property's ability to generate enough net operating income to cover its debt obligations.
Why the Debt Coverage Ratio Matters in Real Estate
In Canadian commercial real estate financing, DCR is a key metric lenders use to assess risk.
Key points:
- Calculated as Net Operating Income ÷ Debt Service
- A DCR above 1.0 indicates sufficient income to cover debt
- Lenders typically require a minimum DCR (e.g., 1.2–1.4)
Understanding DCR helps investors manage leverage and maintain strong property cash flow.
Example of the Debt Coverage Ratio in Action
The lender approved the mortgage because the property had a debt coverage ratio of 1.3, exceeding the minimum requirement.
Key Takeaways
- Indicates property’s ability to cover debt payments
- Higher ratios reduce lender risk
- Calculated using net operating income and debt service
- Critical metric for commercial mortgage approvals
- Helps investors monitor property performance
Related Terms
- Debt Service Ratios
- Net Operating Income
- Loan-to-Value Ratio (LTV)
- Capitalization Rate
- Mortgage Qualification
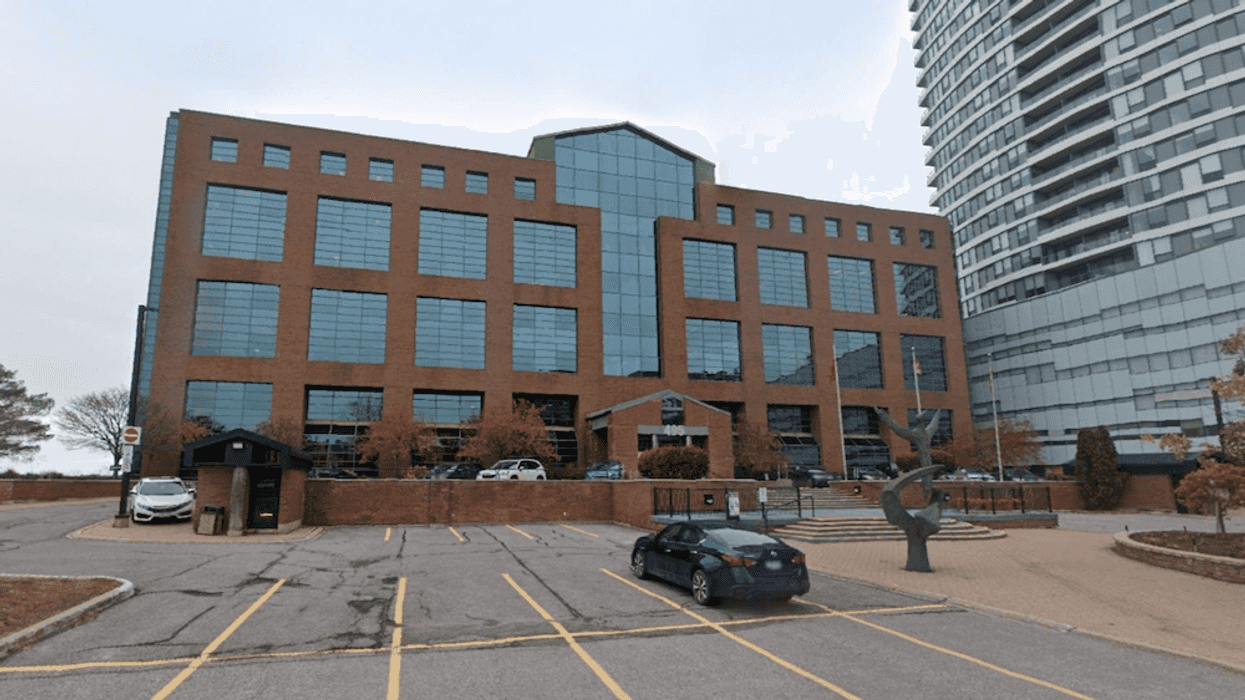
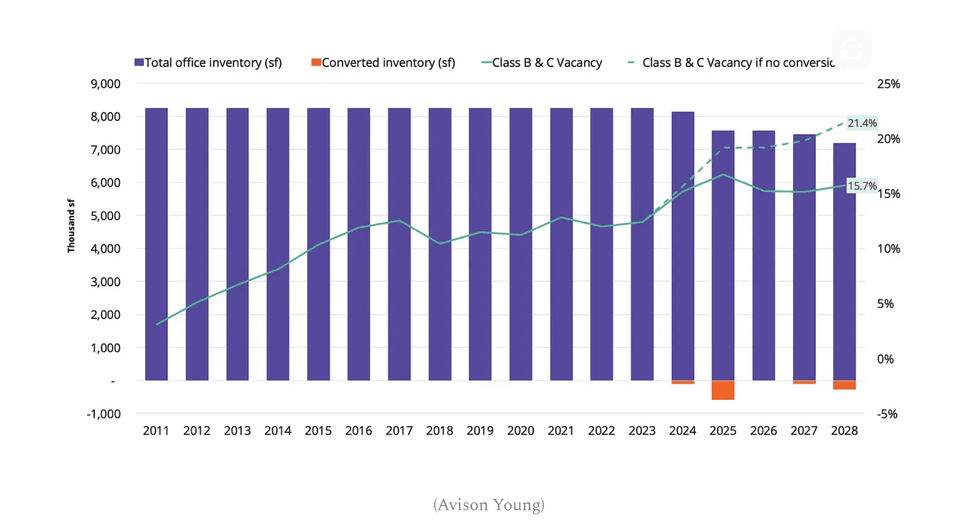 (Avison Young)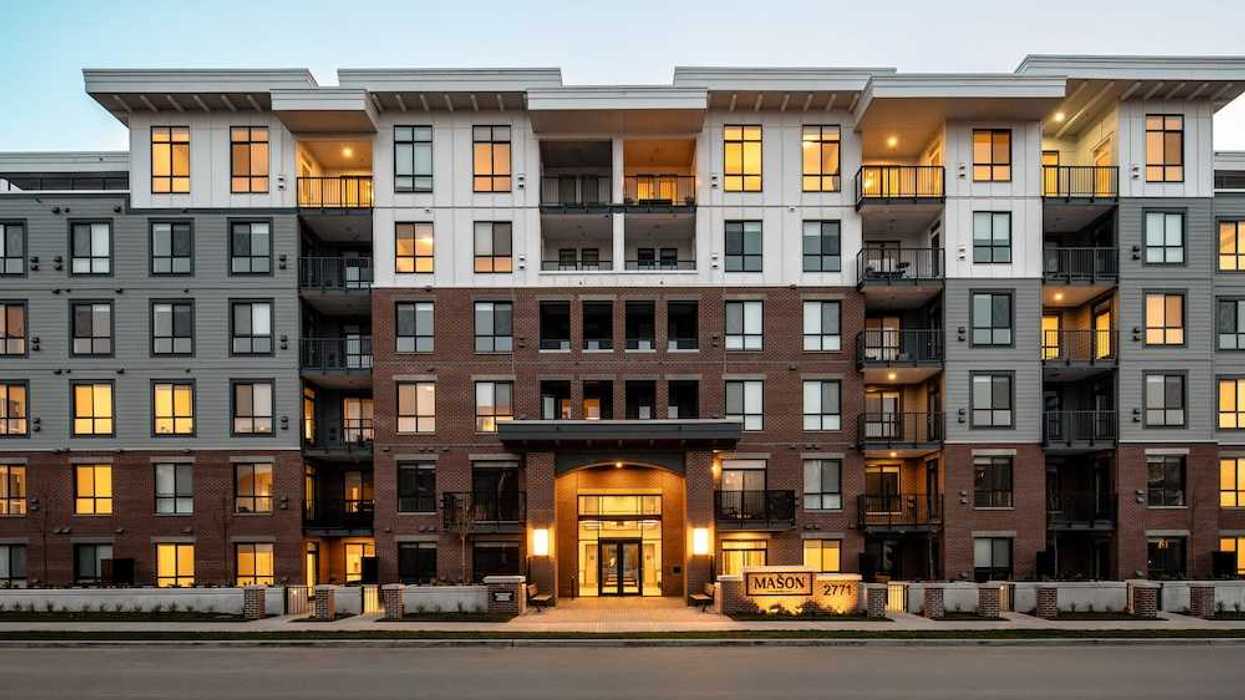
 The Mason Suite Interior (Infinity Properties)
 The Mason Suite Interior (Infinity Properties)
 Rail District aerial (Infinity Properties)
 Versant (Infinity Properties)








 Narrow Fourplex (City of Toronto)
 Wide Sixplex - Side View (City of Toronto)
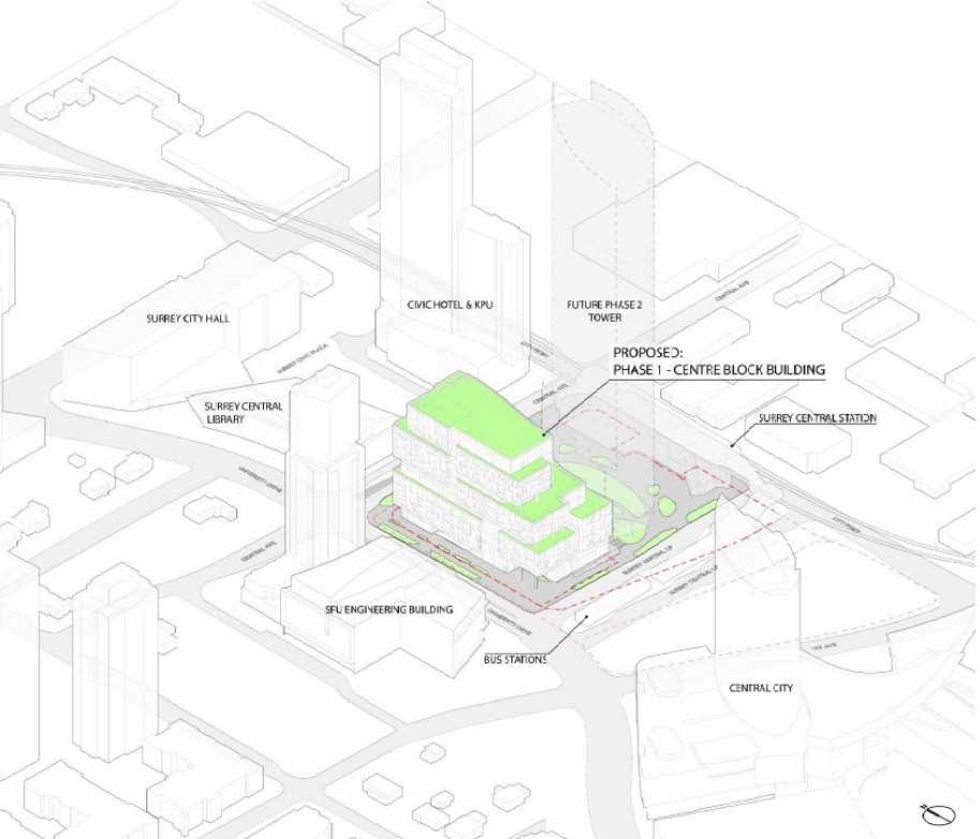 Centre Block and its surrounding context. (Stantec-Revery, SCDC)
 The 12-storey Phase One of Centre Block. (Stantec-Revery, SCDC)
 The 12-storey Phase One of Centre Block. (Stantec-Revery, SCDC)
 Mondria One, set for 1607 King Street East in Clarington, Ontario. (ICON Architects Inc., Monde Development Group)