Occupancy Rate
Learn about occupancy rates in Canadian real estate — how they’re calculated, why they matter, and their role in property performance.
August 01, 2025
What is Occupancy Rate?
Occupancy rate is a measure of how much rentable space in a property or portfolio is currently leased or occupied, expressed as a percentage.
Why Occupancy Rate Matters in Real Estate
In Canadian real estate, occupancy rate is a key indicator of market demand, property performance, and income stability for owners and investors.
How it’s calculated:
- (Occupied units ÷ total available units) × 100
- Can apply to residential, commercial, or mixed-use properties
Understanding occupancy rate helps owners adjust leasing strategies and investors evaluate cash flow potential.
Example of Occupancy Rate in Action
The building’s occupancy rate improved to 95% after a successful marketing campaign filled several vacant units.
Key Takeaways
- Percentage of occupied space in a property
- Indicates demand and property performance
- Impacts income stability for owners
- Used by lenders and investors in evaluations
- Balances with vacancy rate for full picture
Related Terms
- Vacancy Rate
- Allowance for Vacancy
- Property Management
- Operating Costs
- Market Value
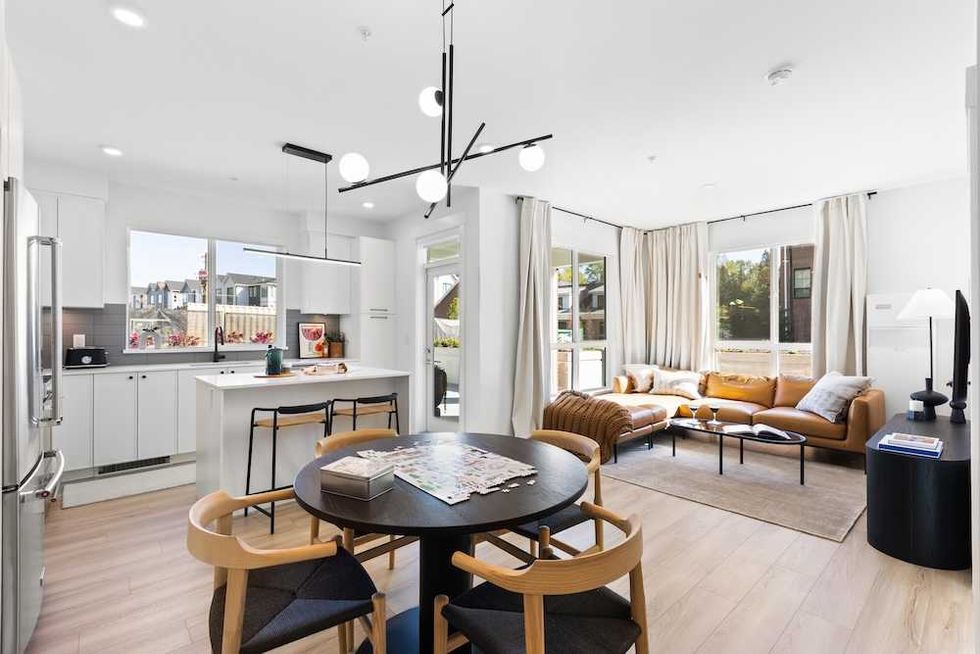 The Mason Suite Interior (Infinity Properties)
 The Mason Suite Interior (Infinity Properties)
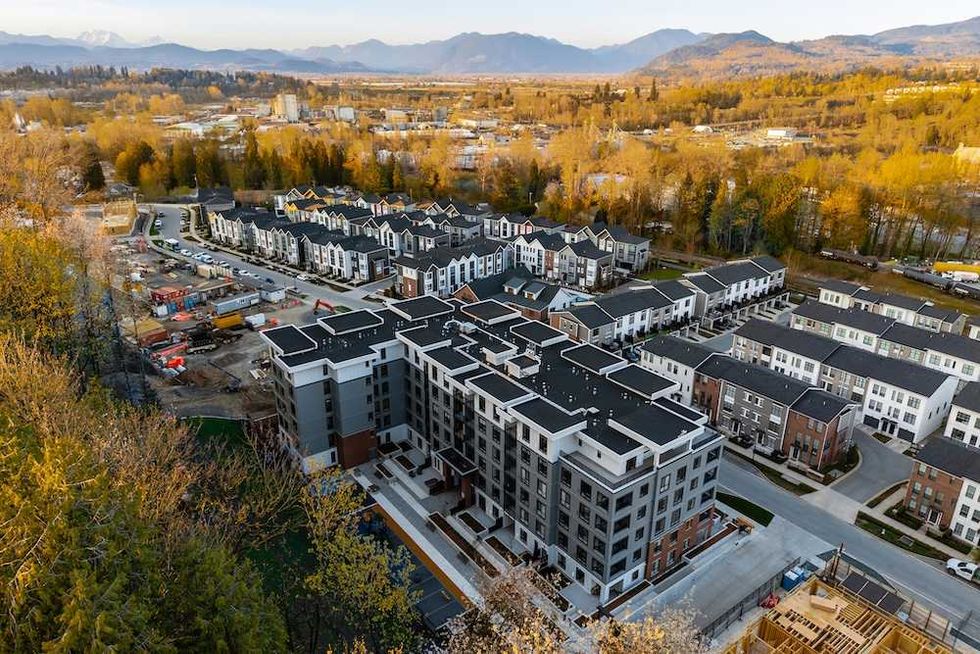 Rail District aerial (Infinity Properties)
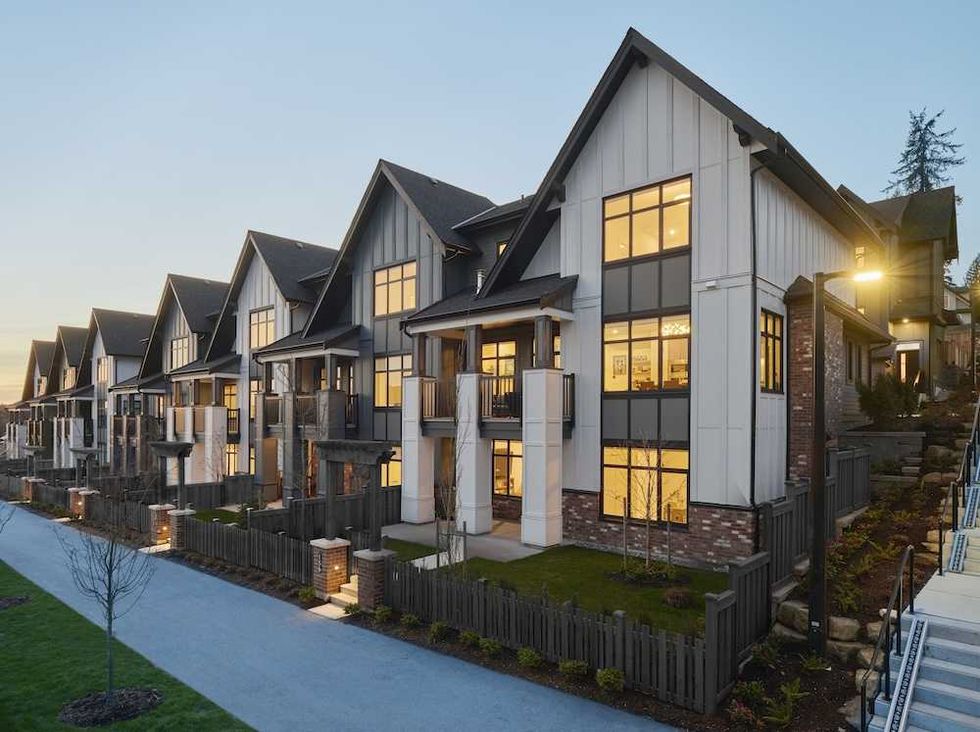 Versant (Infinity Properties)
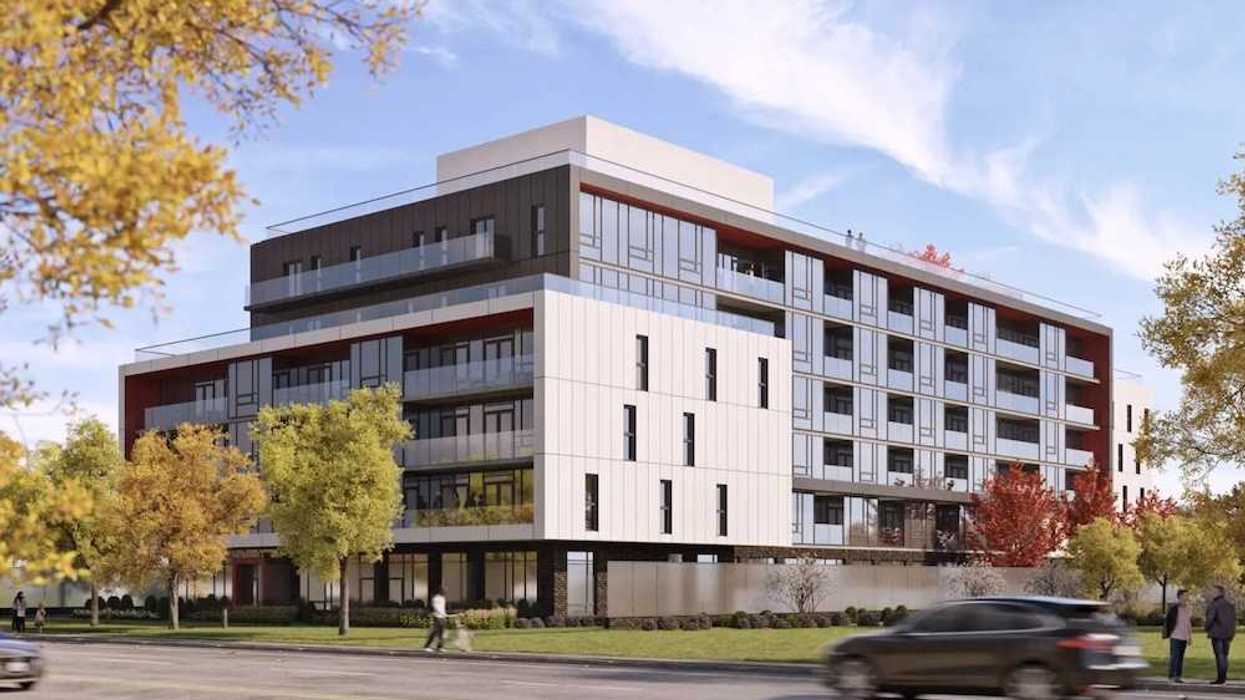
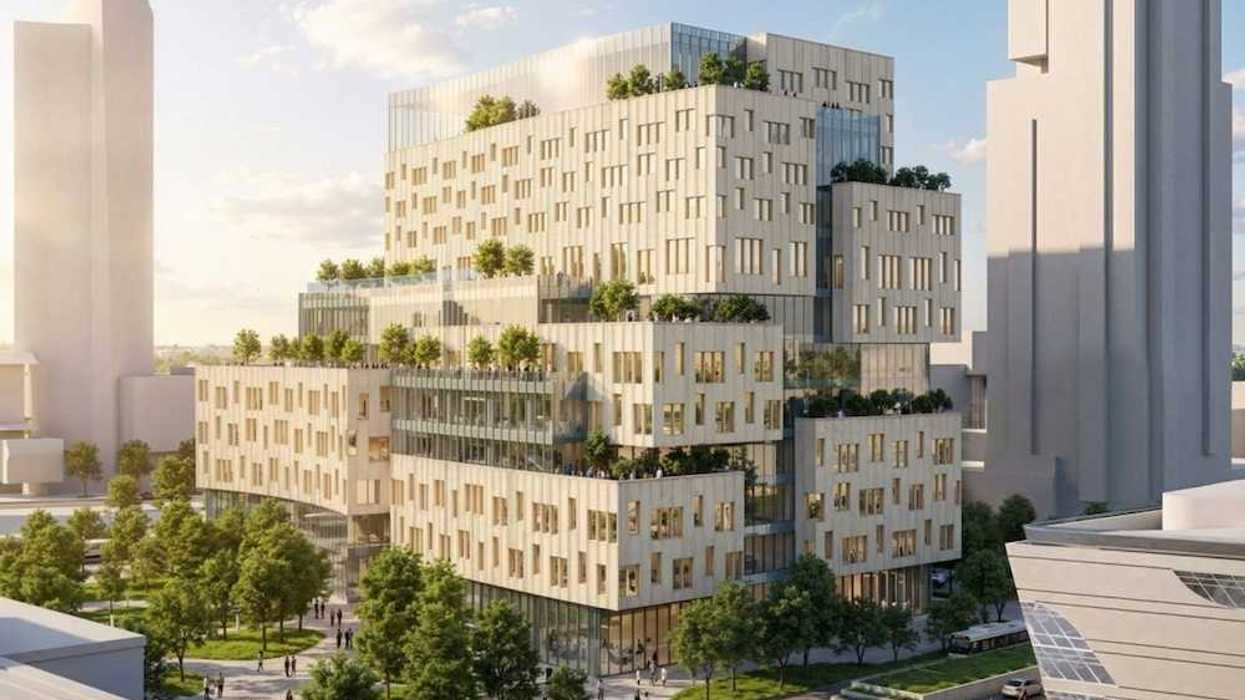



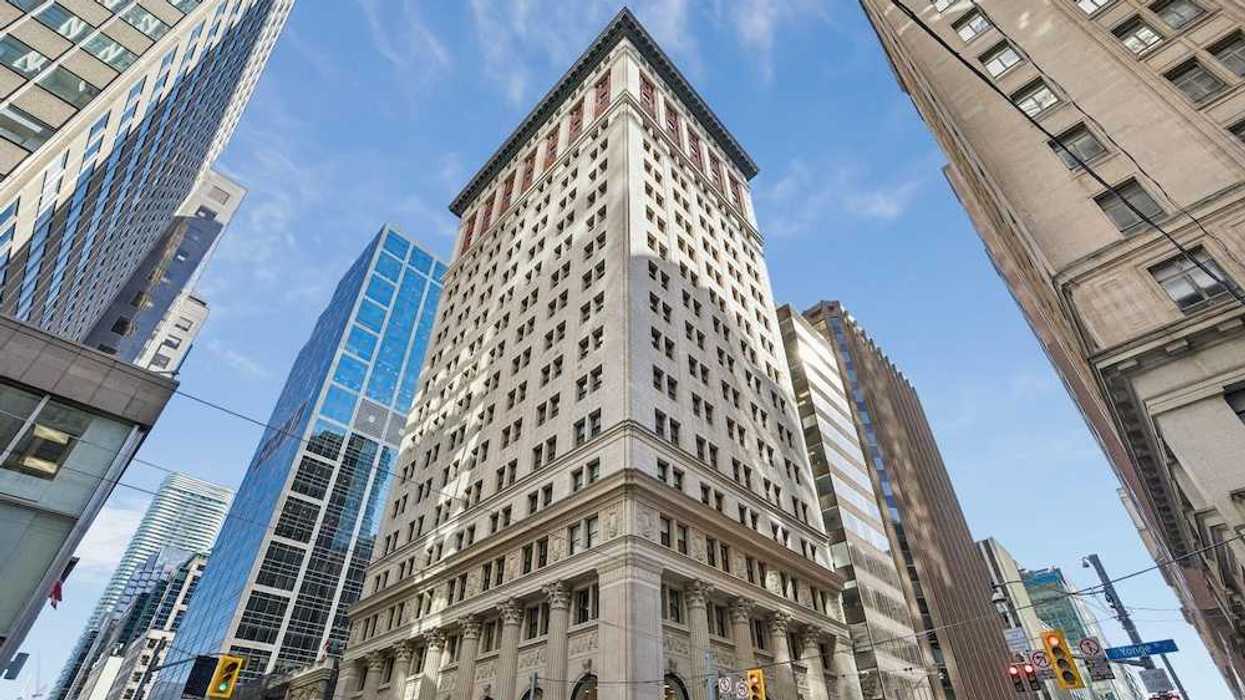
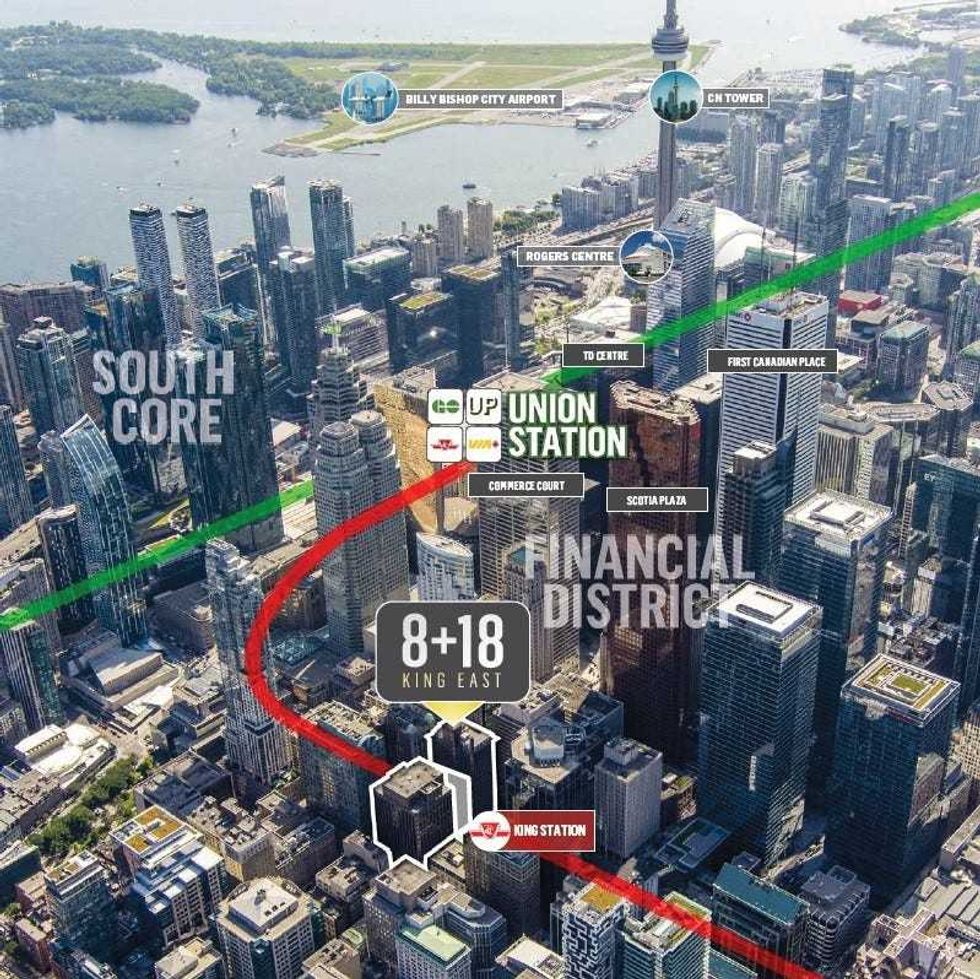 8 and 18 King Street East in Toronto. (RBC Capital Markets Realty)
 Interior photos of 8 and 18 King Street East. (RBC Capital Markets Realty)
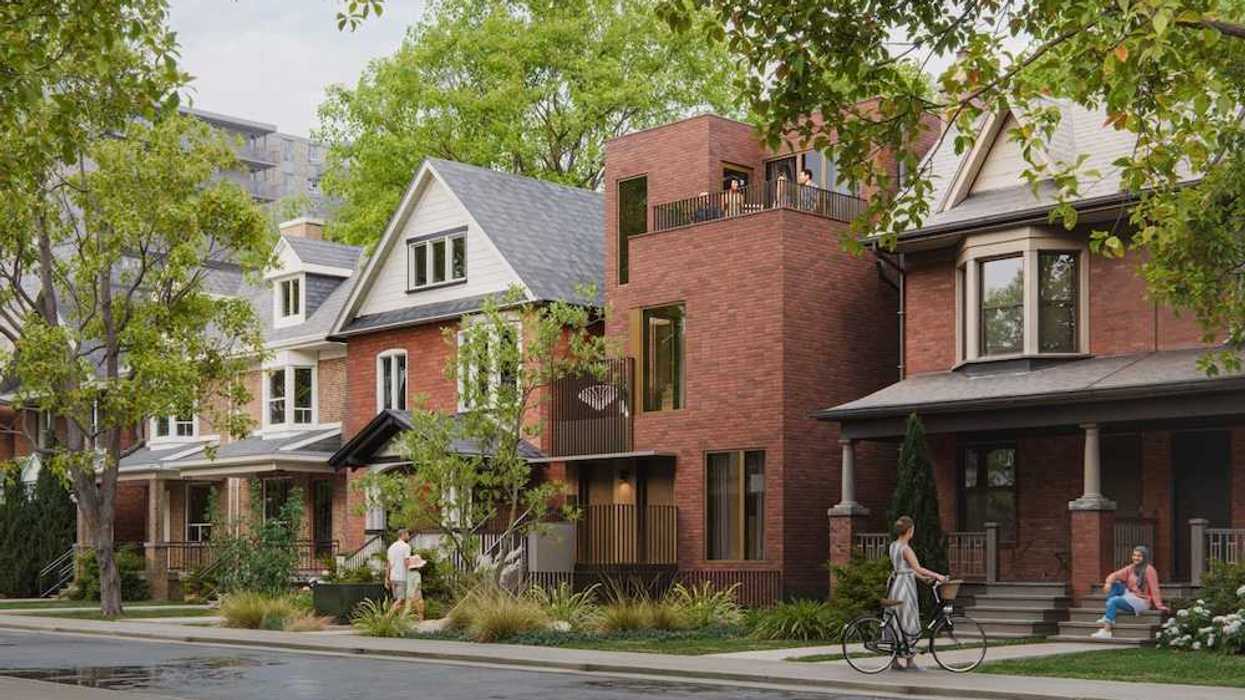
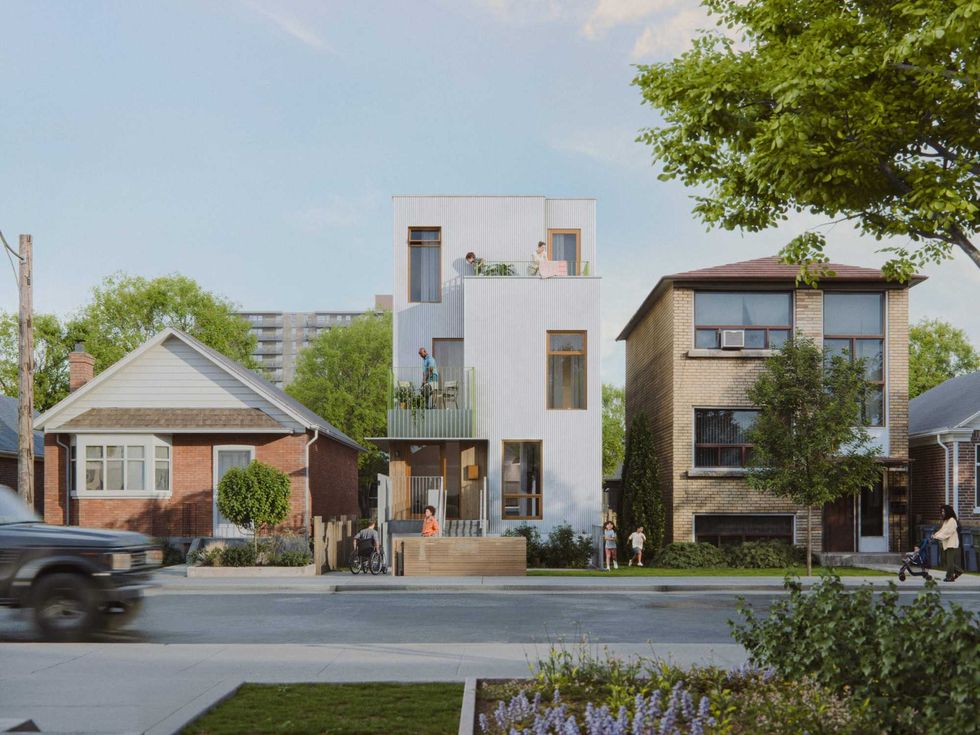 Narrow Fourplex (City of Toronto)
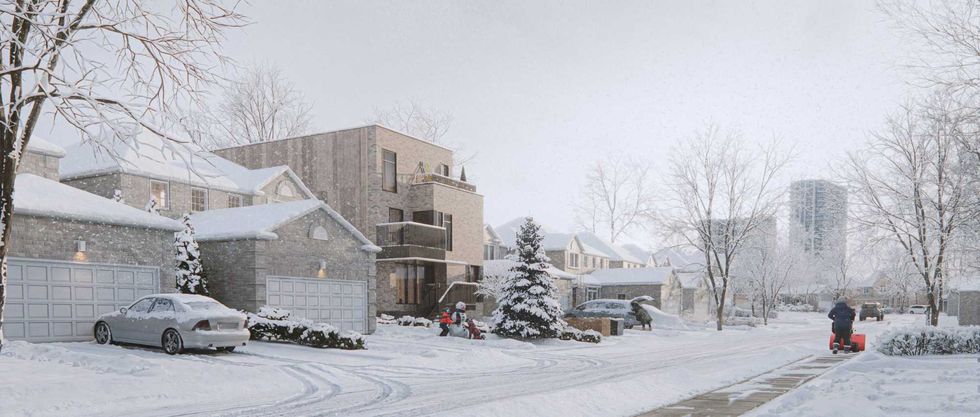 Wide Sixplex - Side View (City of Toronto)