Home Equity
Learn what home equity is, how to calculate it, and how Canadian homeowners can use it to unlock funds or build financial stability.

May 22, 2025
What is Home Equity?
Home equity is the difference between a property’s market value and the outstanding balance on any mortgage or home loan secured against it.
Why Does Home Equity Matter in Real Estate
In Canadian real estate, home equity represents a homeowner’s financial stake in their property. It increases as the mortgage is paid down or the property appreciates in value.
Equity can be accessed through refinancing, a home equity loan, or a HELOC (Home Equity Line of Credit). These funds can be used for renovations, investments, or debt consolidation.
It also plays a role in loan-to-value (LTV) calculations, which impact mortgage terms, insurance, and interest rates. More equity generally means lower lender risk and better borrowing terms.
Understanding home equity helps homeowners build financial security and tap into property value when needed.
Example of Home Equity in Action
A home valued at $850,000 with a mortgage balance of $500,000 gives the owner $350,000 in home equity.
Key Takeaways
- The portion of the property the owner truly owns.
- Increases with appreciation and mortgage payments.
- Can be used for borrowing or reinvestment.
- Impacts loan approval and interest rates.
- Key tool for financial planning.
Related Terms
- Refinance
- HELOC
- Loan-to-Value Ratio (LTV)
- Mortgage
- Real Estate Investing

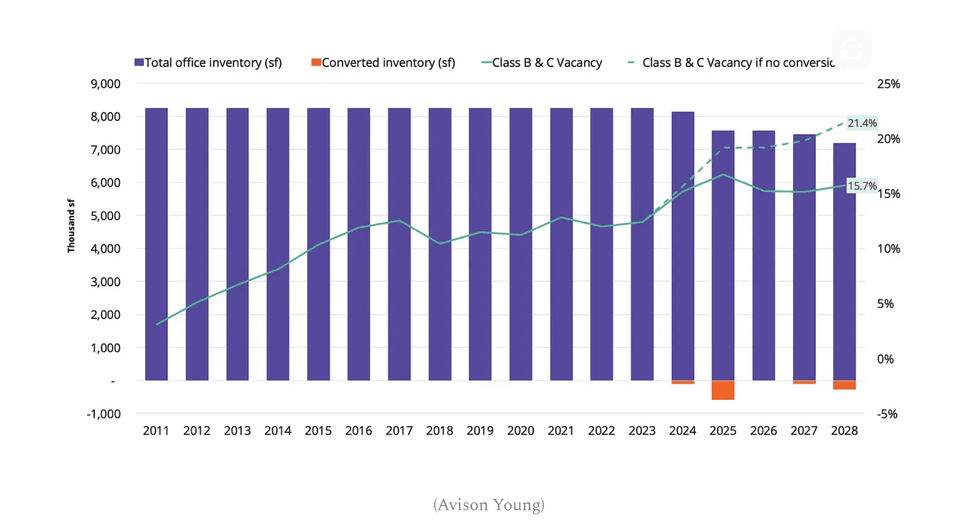 (Avison Young)



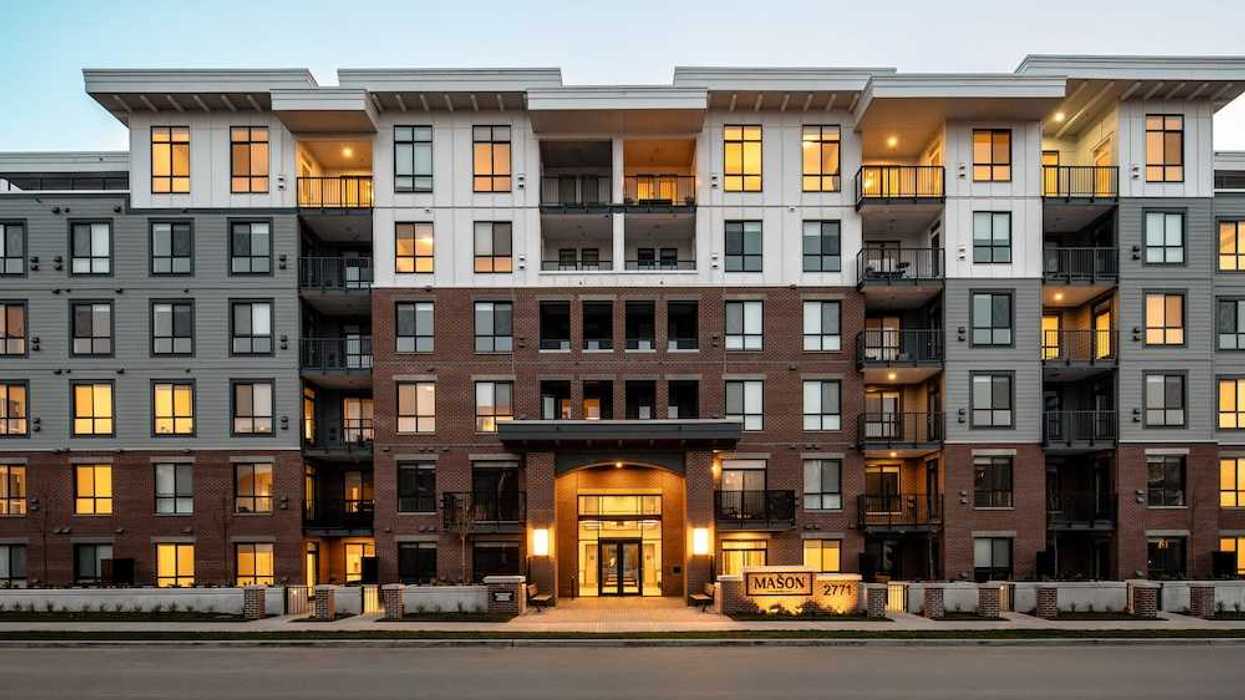
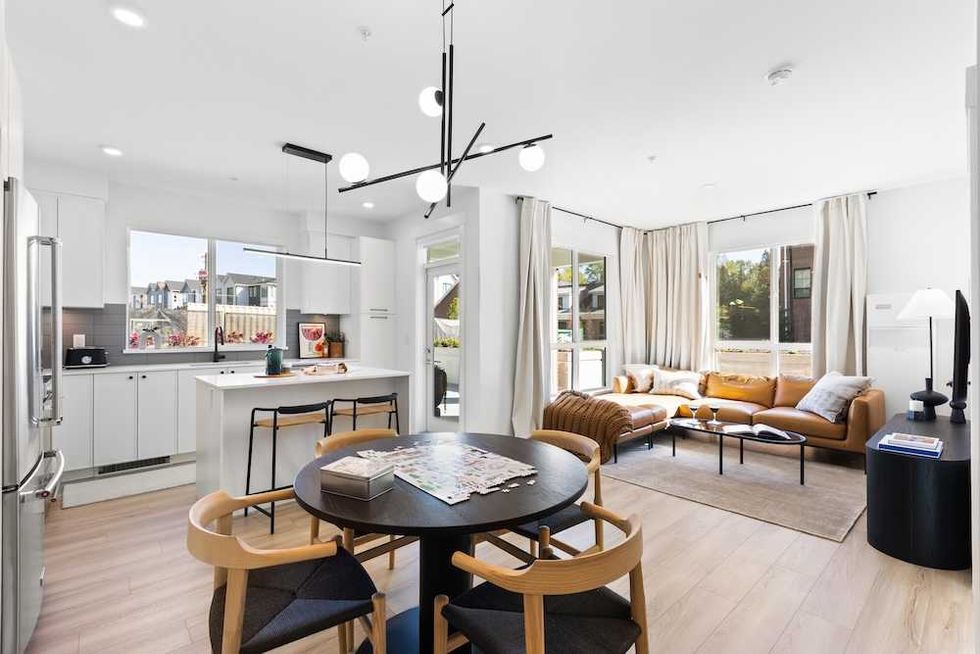 The Mason Suite Interior (Infinity Properties)
 The Mason Suite Interior (Infinity Properties)
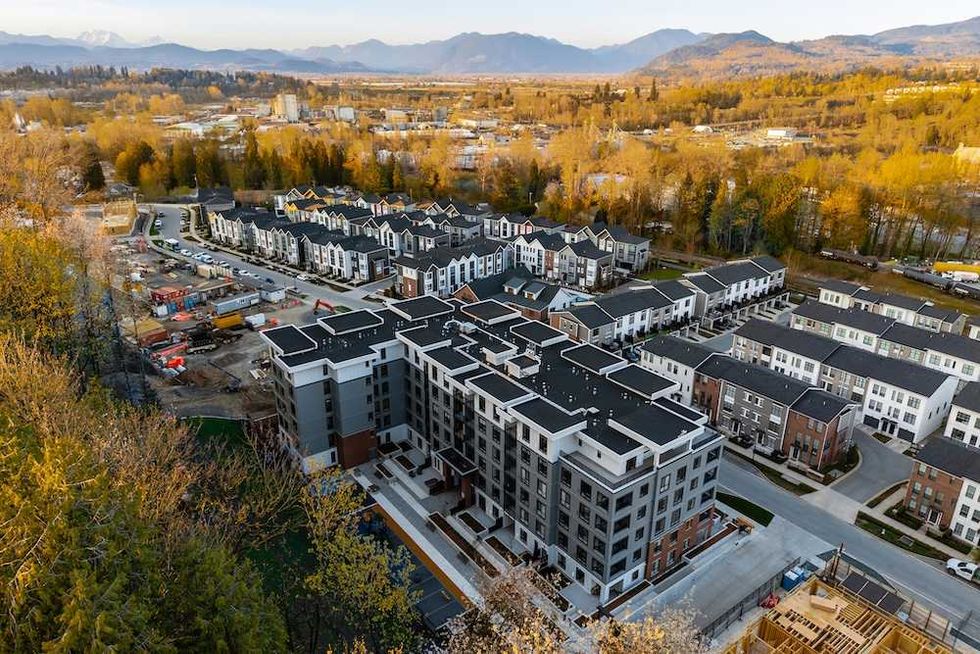 Rail District aerial (Infinity Properties)
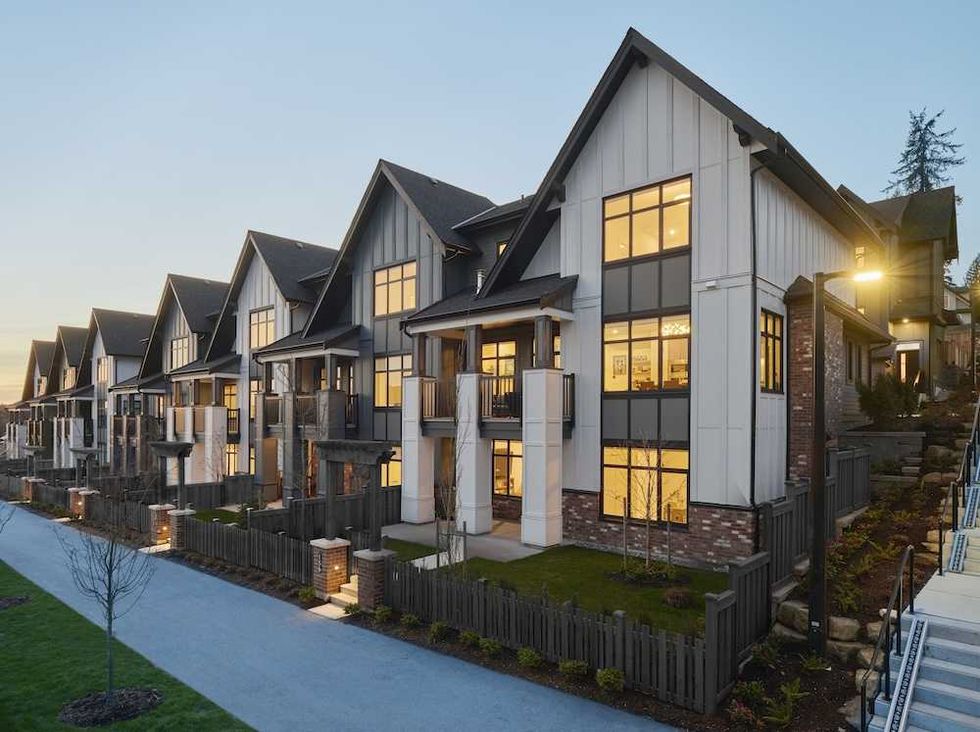 Versant (Infinity Properties)

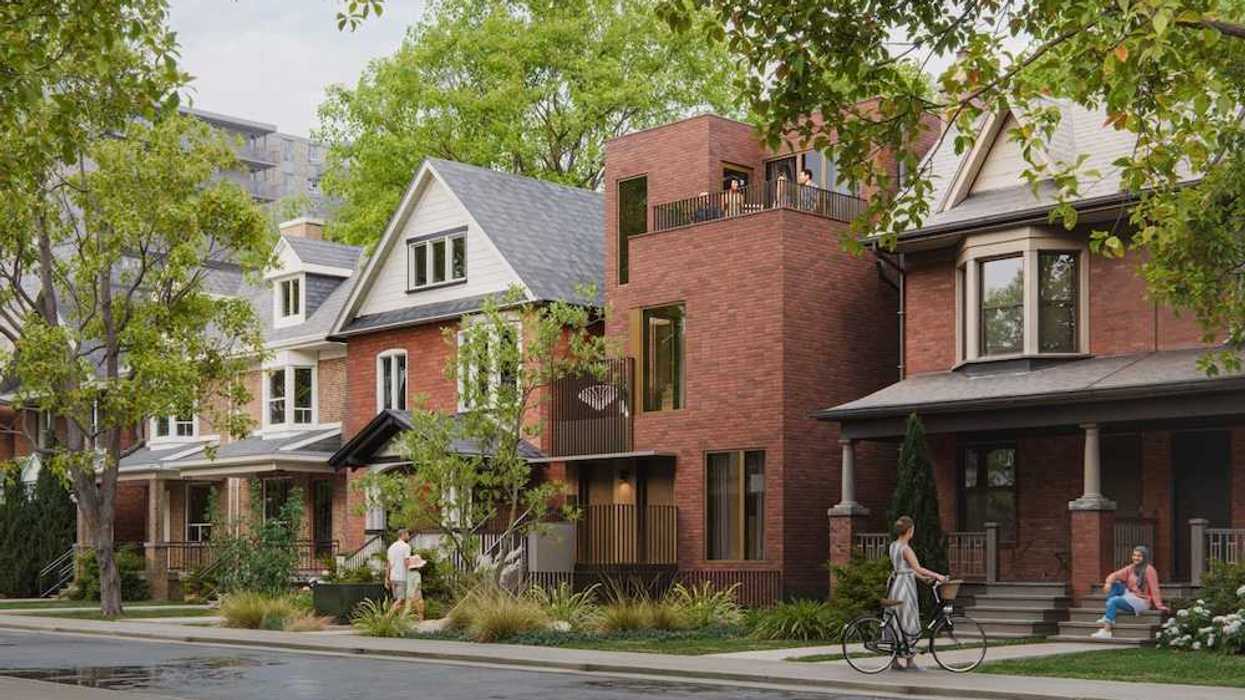
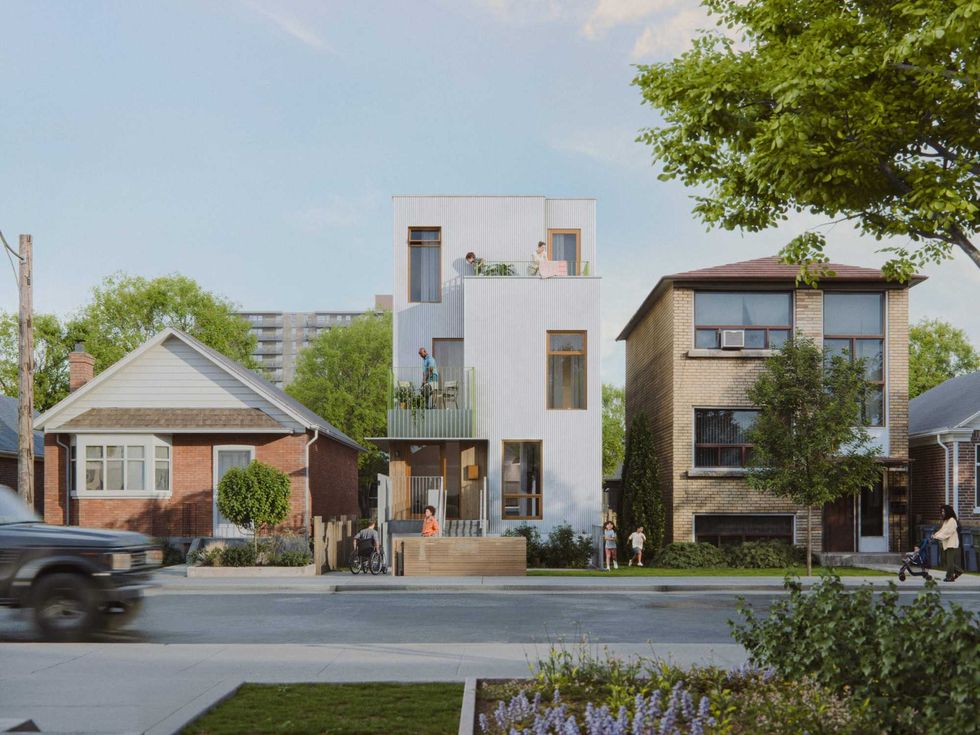 Narrow Fourplex (City of Toronto)
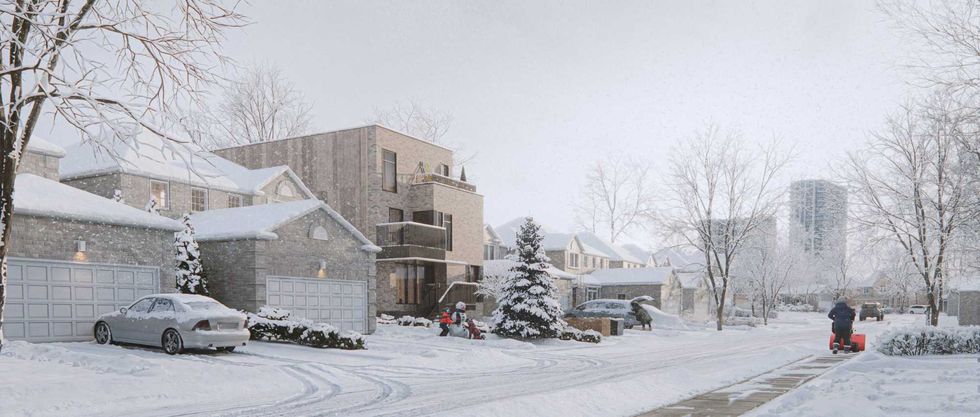 Wide Sixplex - Side View (City of Toronto)
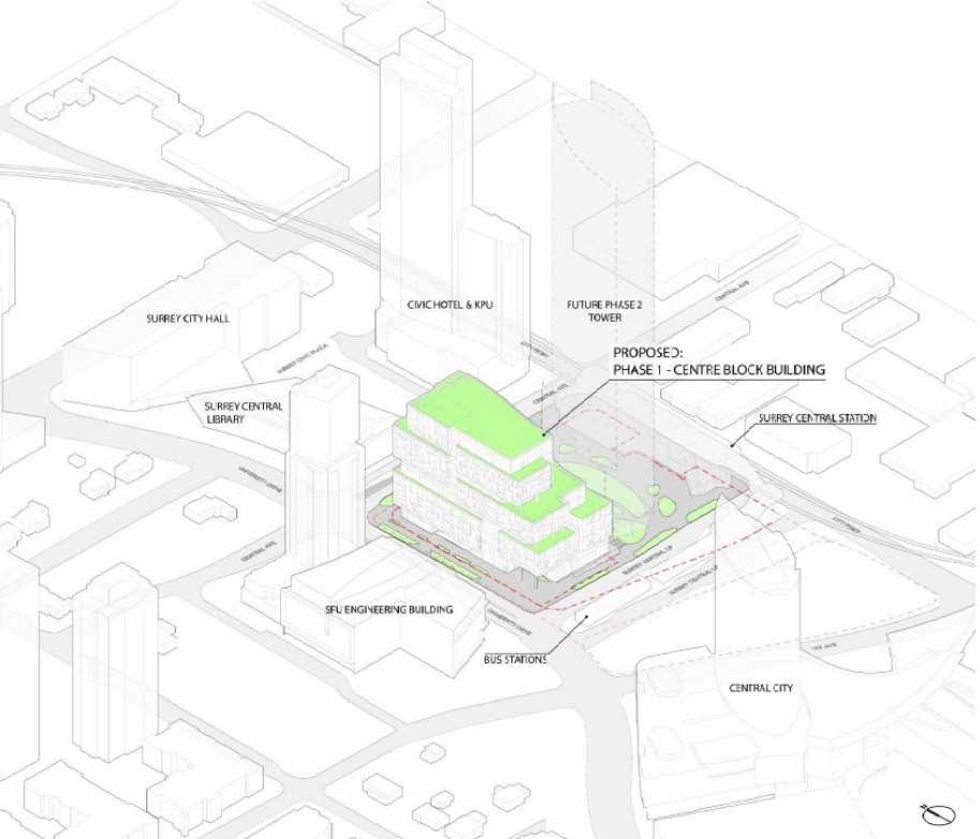 Centre Block and its surrounding context. (Stantec-Revery, SCDC)
 The 12-storey Phase One of Centre Block. (Stantec-Revery, SCDC)
 The 12-storey Phase One of Centre Block. (Stantec-Revery, SCDC)
 Mondria One, set for 1607 King Street East in Clarington, Ontario. (ICON Architects Inc., Monde Development Group)