Cooling Degree Days
Cooling degree days (CDD) are a climate metric used to assess cooling energy demand in buildings and plan for HVAC efficiency and sustainability.

September 30, 2025
What are Cooling Degree Days?
Cooling degree days (CDD) are a climate metric used to estimate cooling demand in buildings. They are calculated by summing the difference between the daily average temperature and a base temperature (commonly 18°C or 65°F) for days above the threshold. Higher CDD values mean greater energy demand for air conditioning and cooling systems.
Why Cooling Degree Days Matter in Real Estate
Cooling degree days matter because they impact HVAC design, energy budgeting, and sustainability planning. Developers, engineers, and property managers use CDD data to estimate long-term operating costs, identify retrofit opportunities, and compare energy performance across properties or regions. Rising CDD values also highlight climate change implications for the built environment.
Example of Cooling Degree Days in Action
A property manager tracks CDD trends and finds that one multifamily building consistently consumes more cooling energy than expected. Benchmarking against CDD data reveals inefficiencies in insulation and HVAC systems, leading to a retrofit that reduces operating costs by 15%.
Key Takeaways
- Cooling degree days measure climate-related cooling demand.
- They are vital for HVAC design and retrofit planning.
- Higher CDD values signal greater energy consumption.
- Benchmarking against CDD improves efficiency strategies.
- Climate change increases the importance of monitoring CDDs.
Related Terms
- Energy Benchmarking
- HVAC Systems
- Green Building Certification
- Operating Costs
- Sustainability
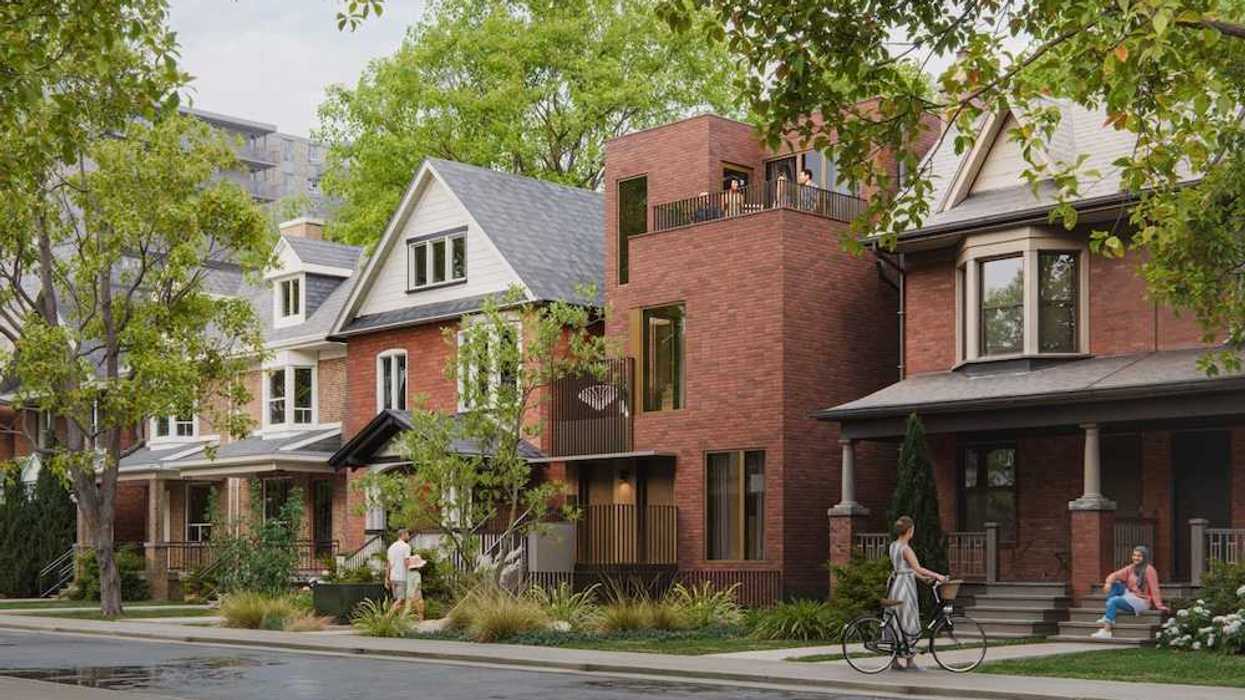
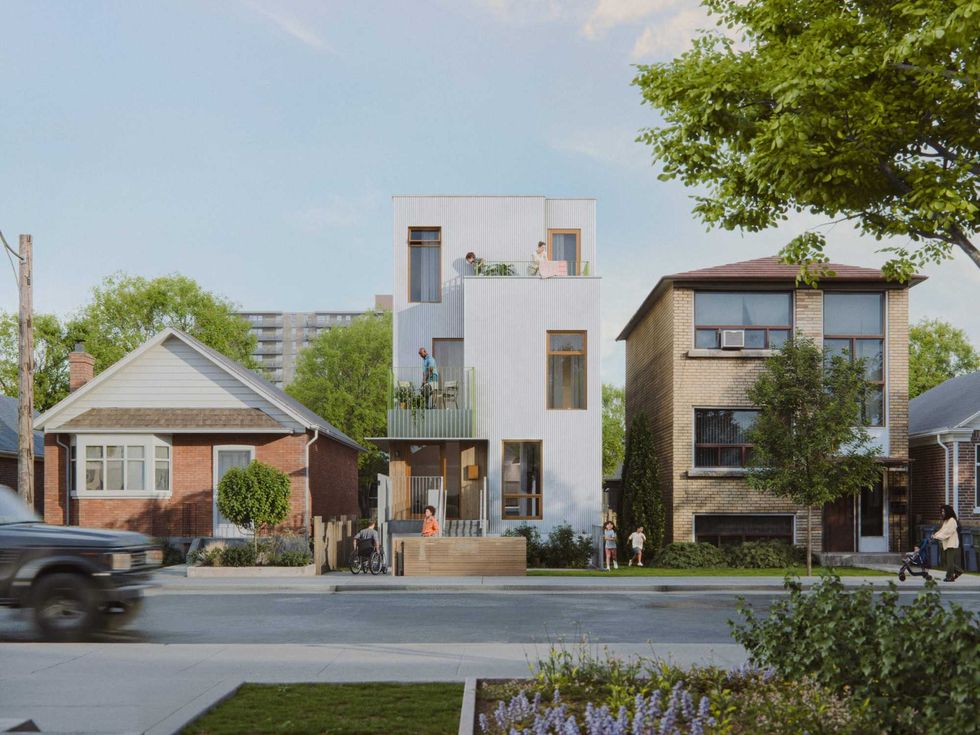 Narrow Fourplex (City of Toronto)
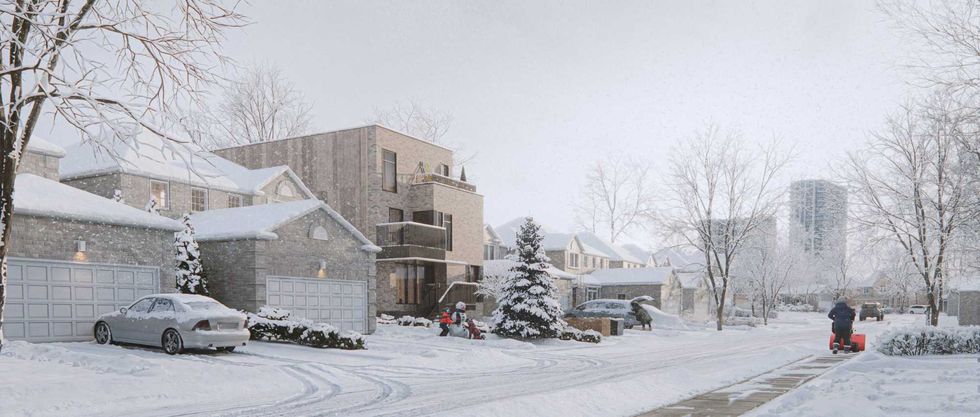 Wide Sixplex - Side View (City of Toronto)
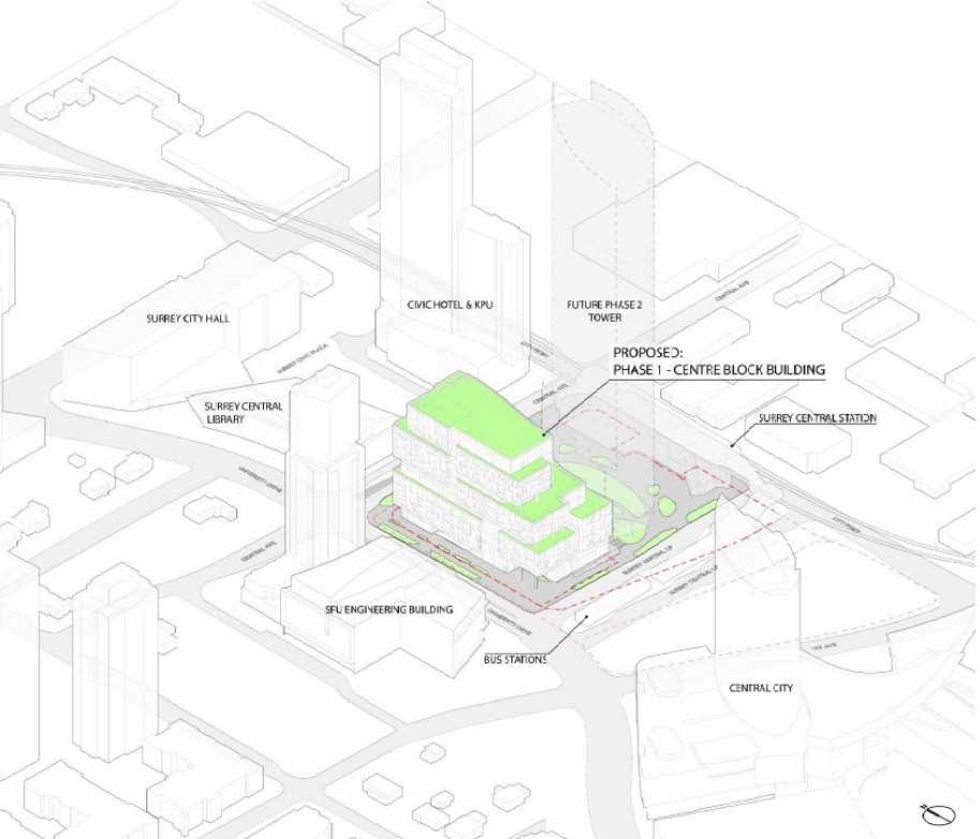 Centre Block and its surrounding context. (Stantec-Revery, SCDC)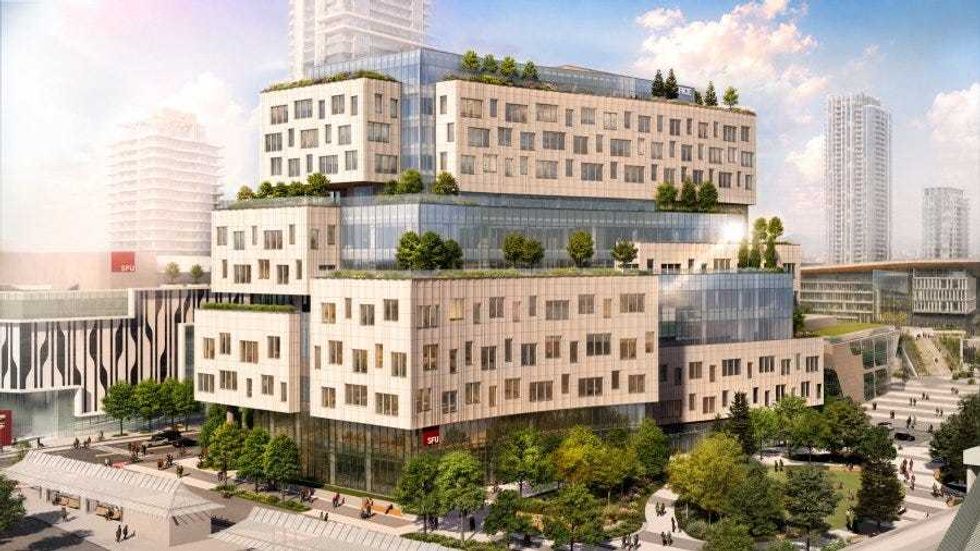
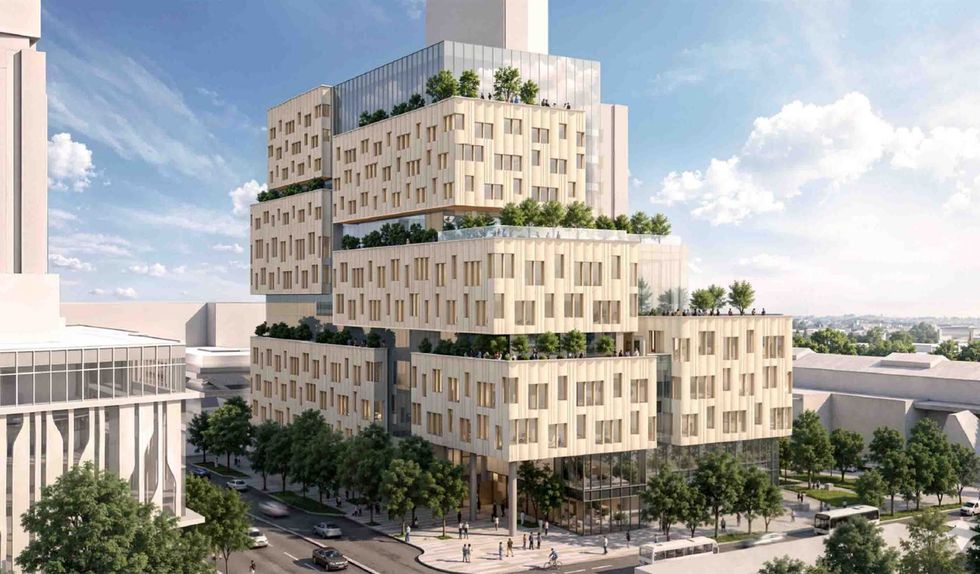 The 12-storey Phase One of Centre Block. (Stantec-Revery, SCDC)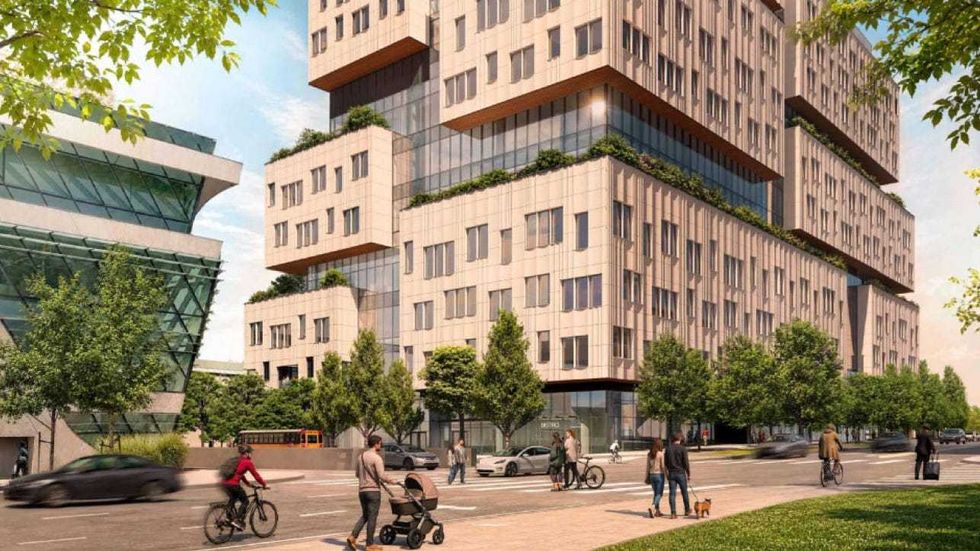
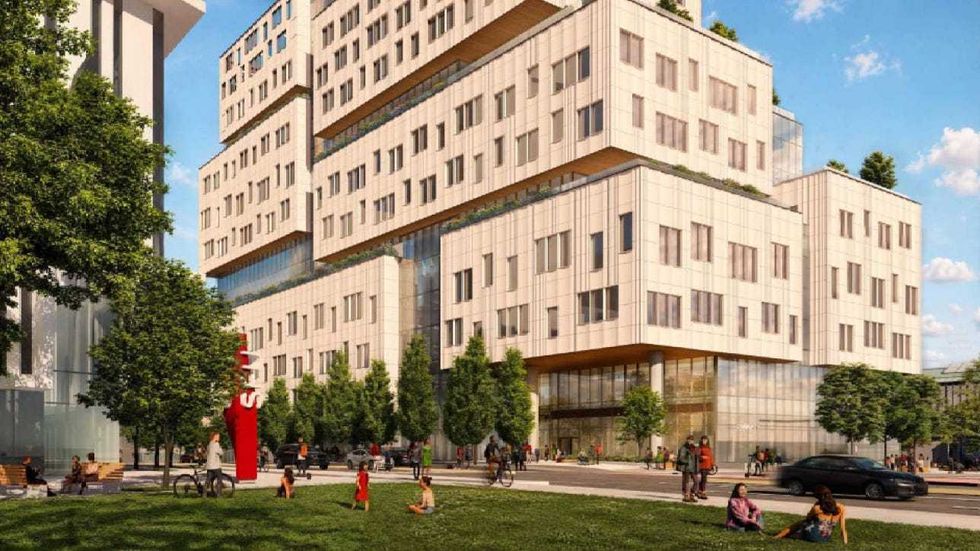 The 12-storey Phase One of Centre Block. (Stantec-Revery, SCDC)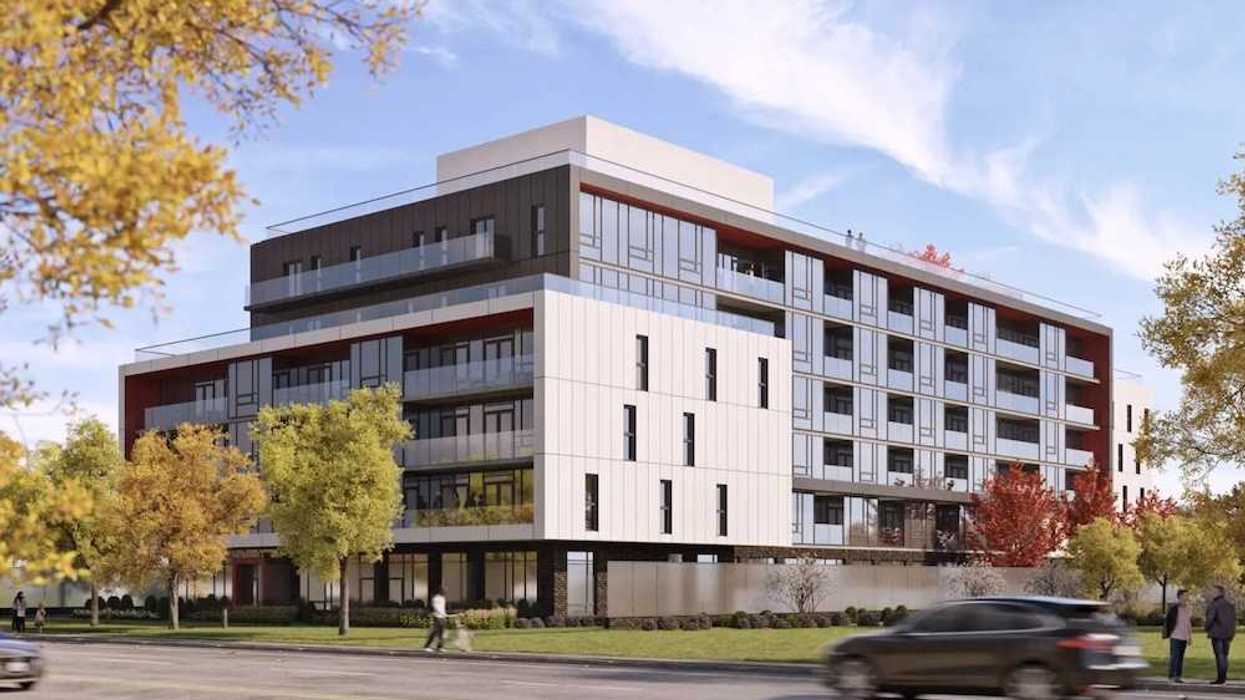




 Via STOREYS Editorial team
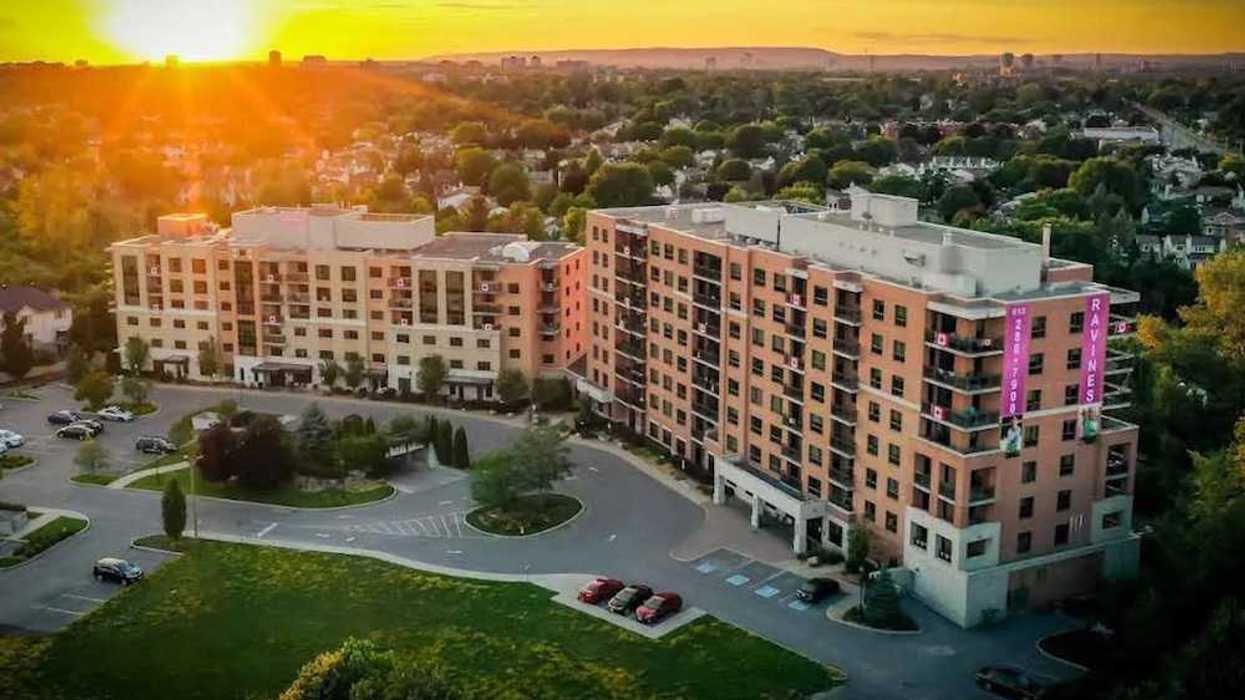
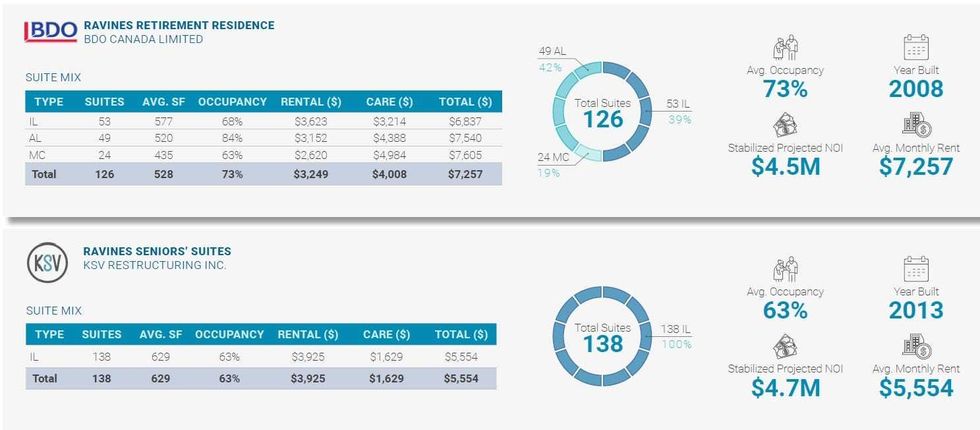 An overview of the two Ravine buildings. (Newmark)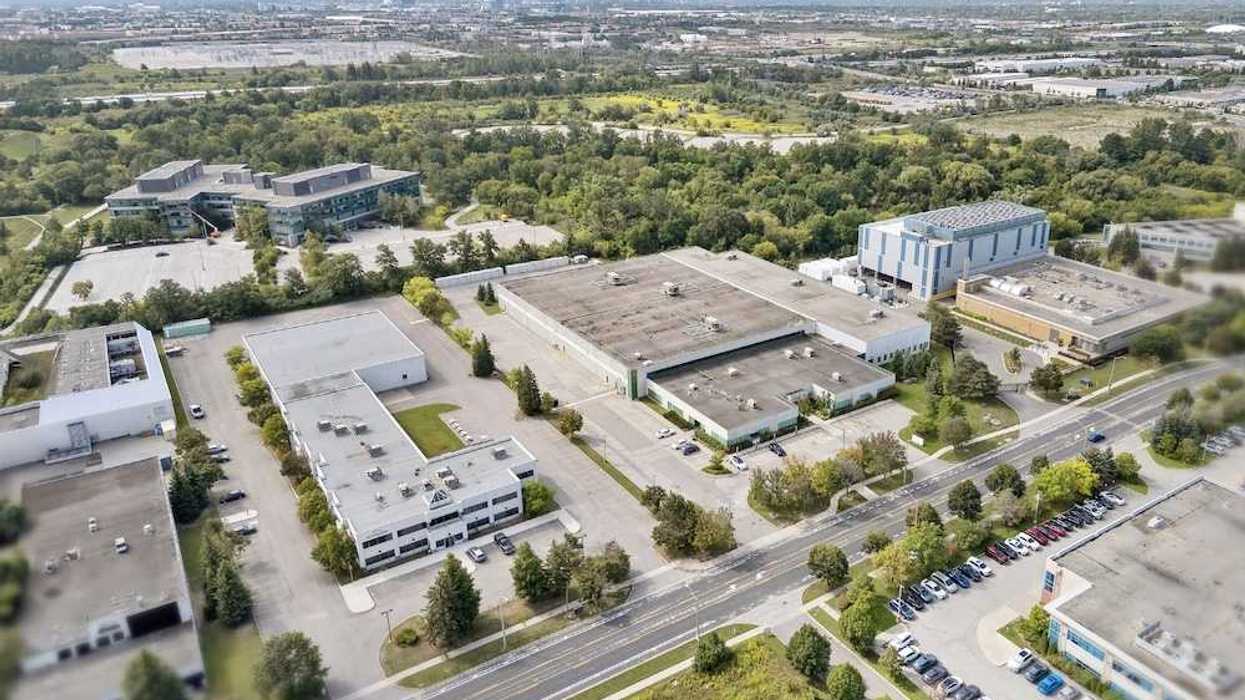
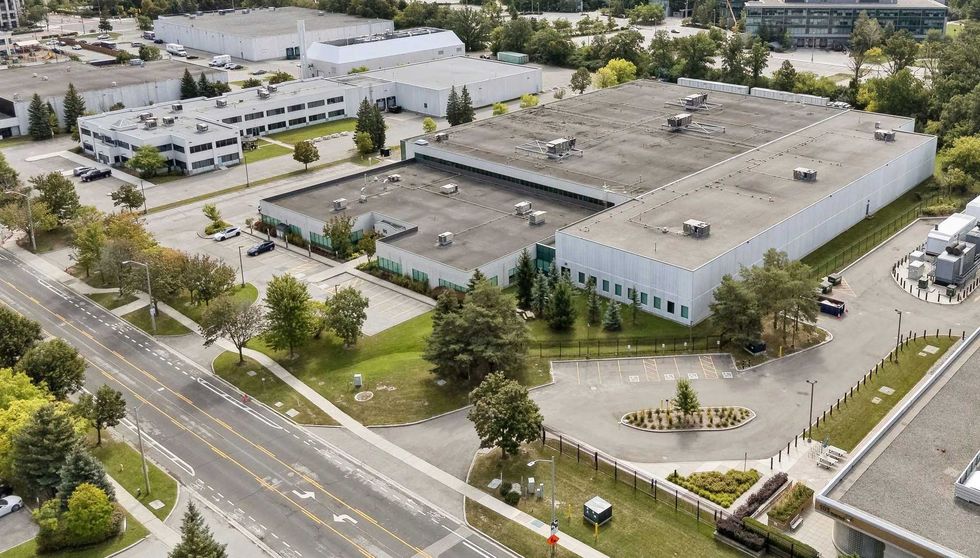 95 Clegg Road in Markham, Ontario. (Colliers)
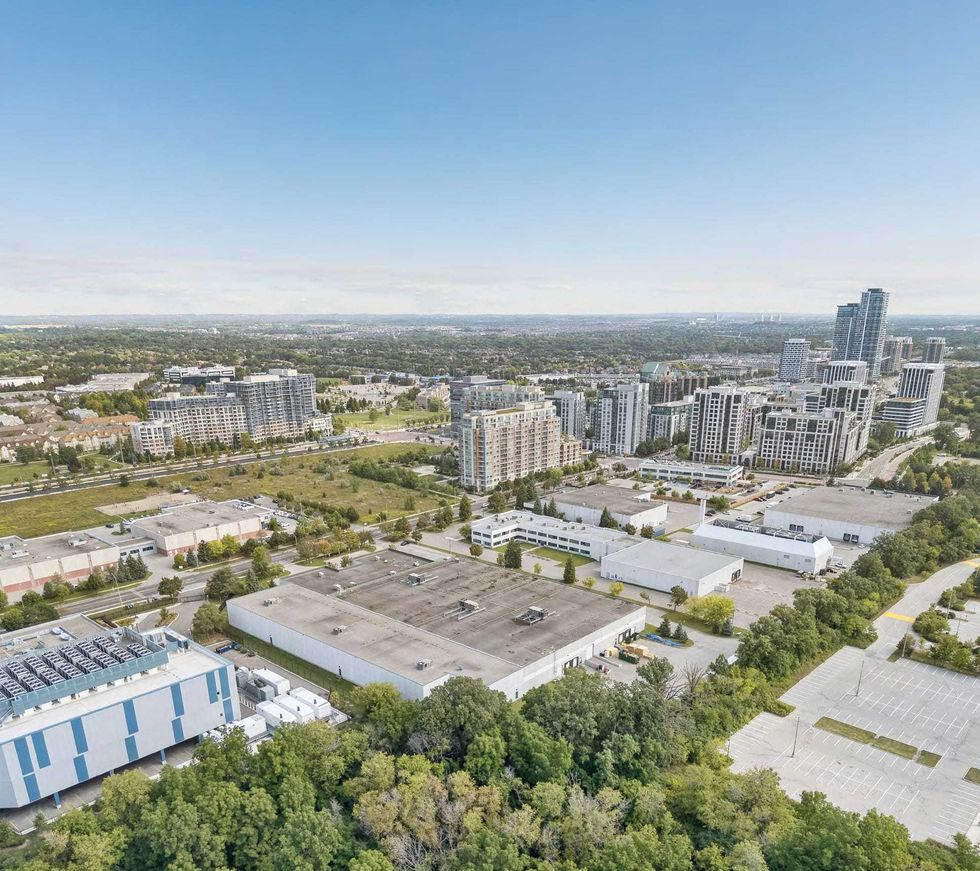 95 Clegg Road (centre) in Markham, Ontario. (Colliers)