Energy Benchmarking
Energy benchmarking is the practice of measuring building energy use against peers or past performance to identify inefficiencies and boost value.

September 30, 2025
What is Energy Benchmarking?
Energy benchmarking is the process of measuring a building’s energy performance against historical data or peer properties. It typically uses standardized tools and weather normalization to ensure comparability. Benchmarking highlights inefficiencies, tracks progress toward sustainability goals, and informs decisions about retrofits, certifications, and operating budgets.
Why Energy Benchmarking Matters in Real Estate
Energy benchmarking matters in real estate because it provides owners, managers, and investors with critical data about operating costs, environmental impacts, and regulatory compliance. Many jurisdictions require annual benchmarking disclosures. Strong performance can improve asset value, attract tenants, and qualify for incentive programs.
Example of Energy Benchmarking in Action
An office building completes energy benchmarking and discovers plug loads are significantly higher than peers. Management launches a tenant engagement program and lighting retrofit, cutting energy use by 18% year-over-year.
Key Takeaways
- Benchmarking identifies inefficiencies and informs retrofits.
- Mandatory in some cities for compliance.
- Supports sustainability certifications and goals.
- Improves marketability and asset value.
- Provides data to track ROI of upgrades.
Related Terms
- Sustainability
- Utility Cost
- Green Building Certification
- Retrofit
- Operating Costs

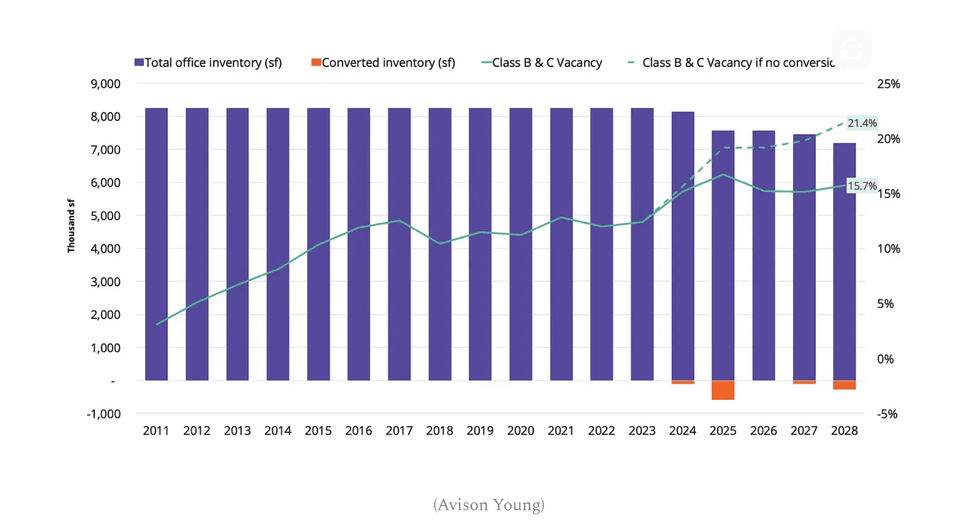 (Avison Young)

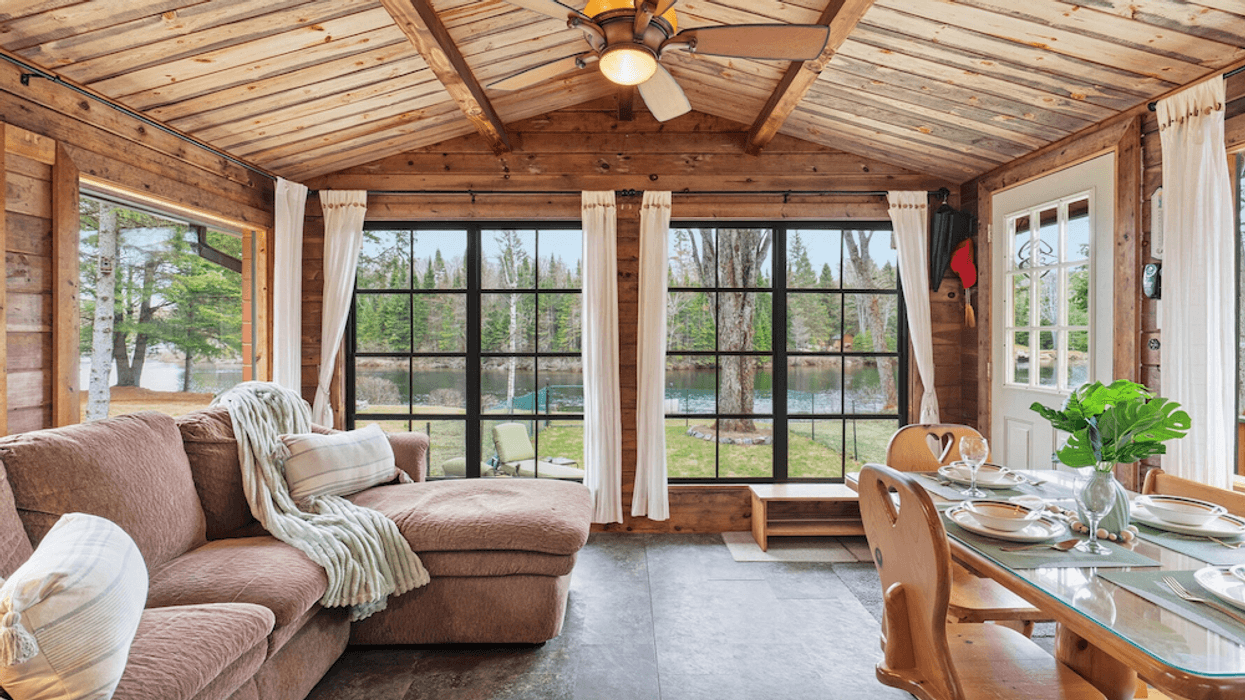



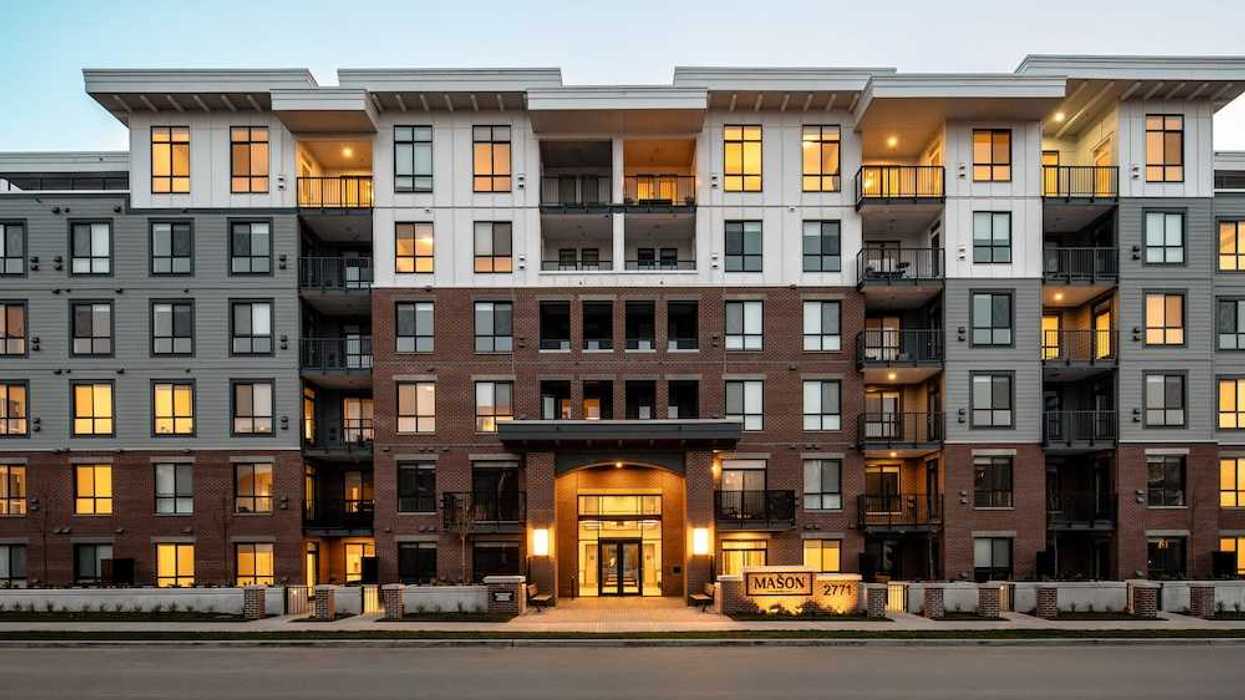
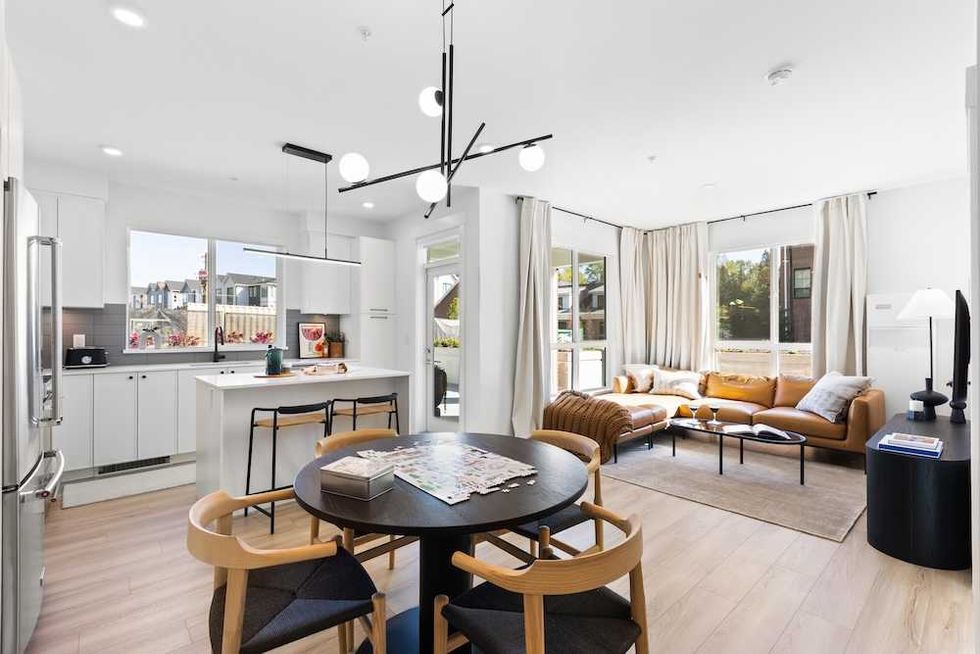 The Mason Suite Interior (Infinity Properties)
 The Mason Suite Interior (Infinity Properties)
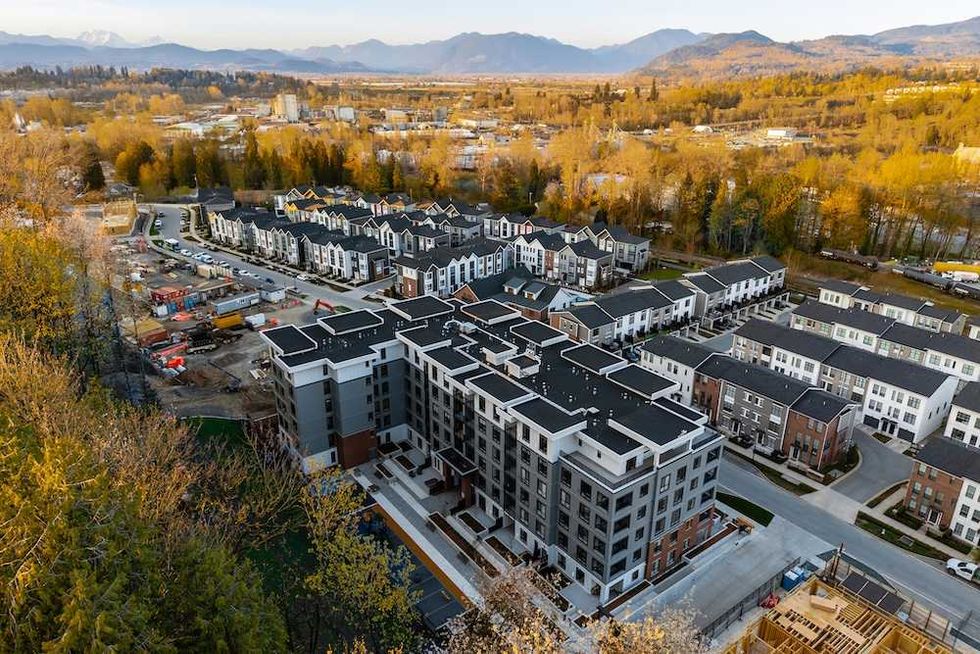 Rail District aerial (Infinity Properties)
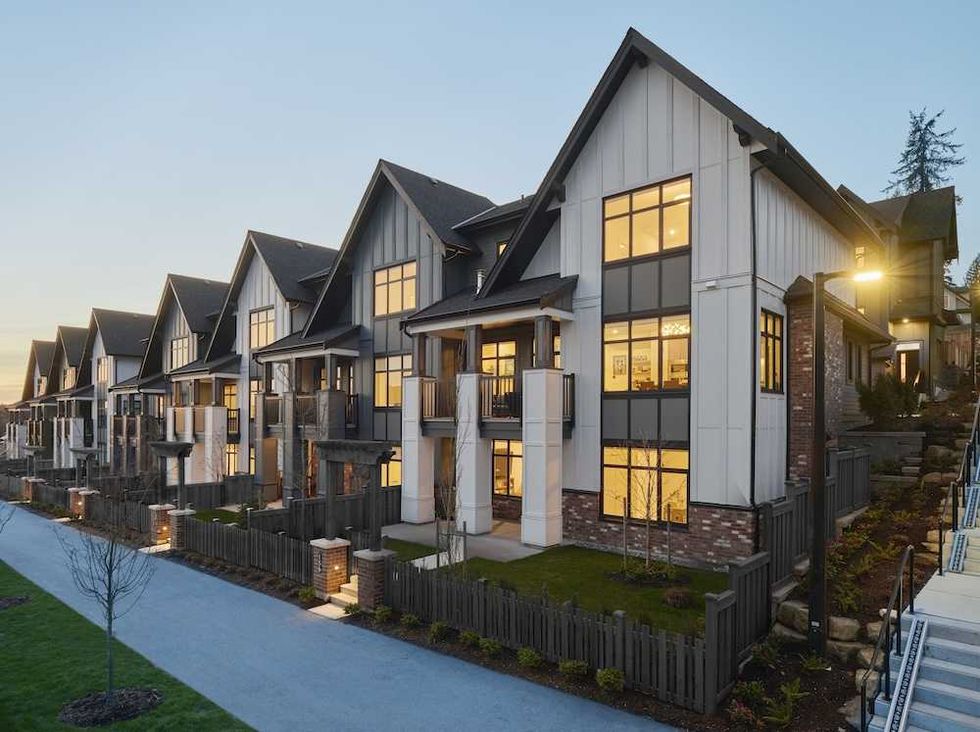 Versant (Infinity Properties)

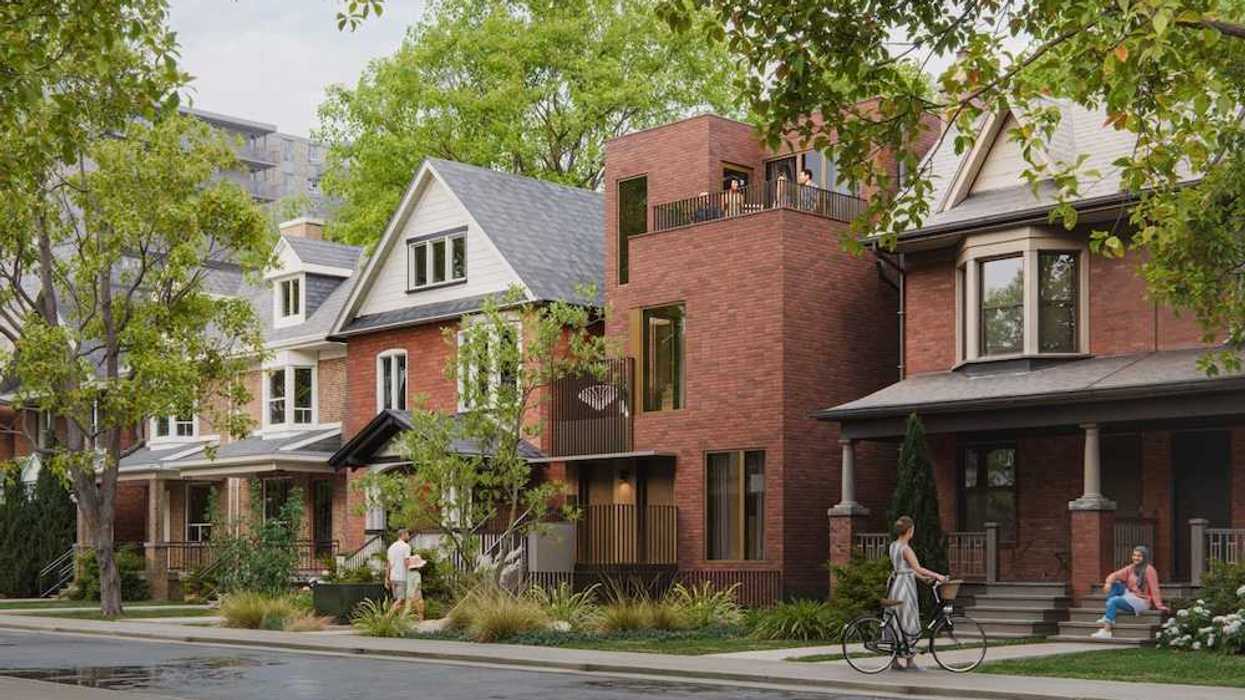
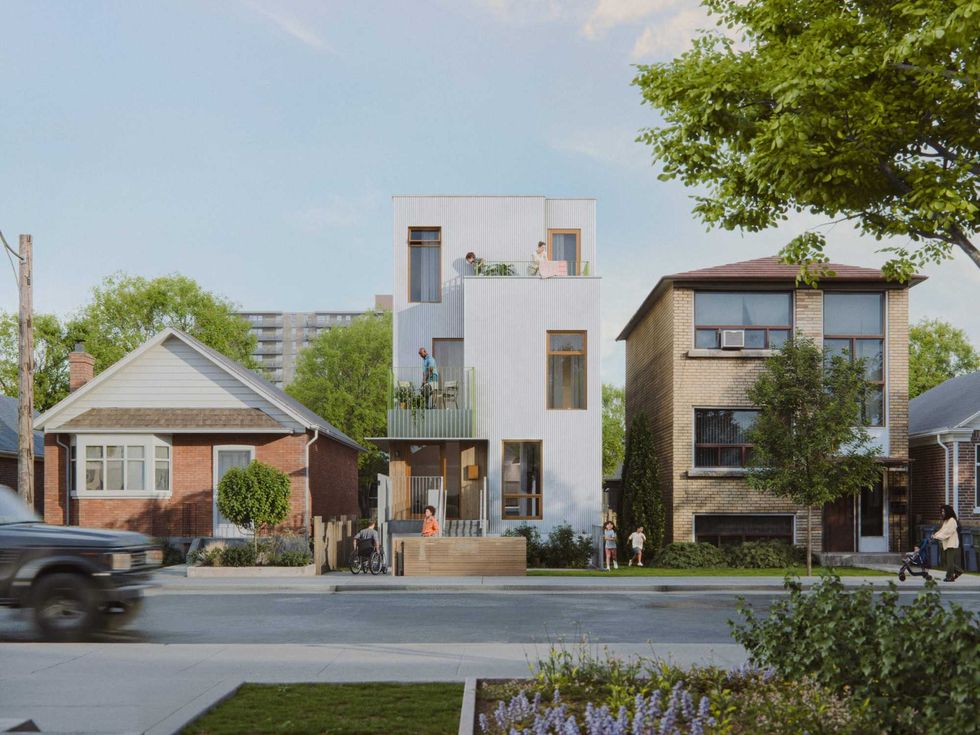 Narrow Fourplex (City of Toronto)
 Wide Sixplex - Side View (City of Toronto)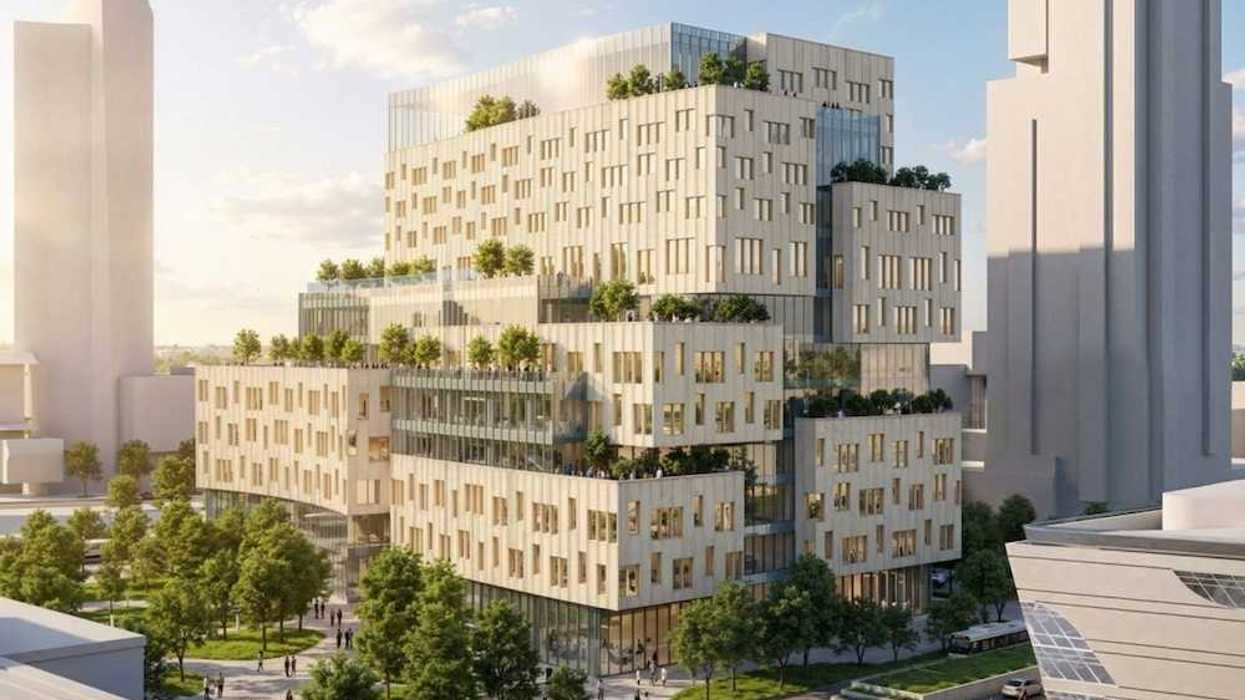
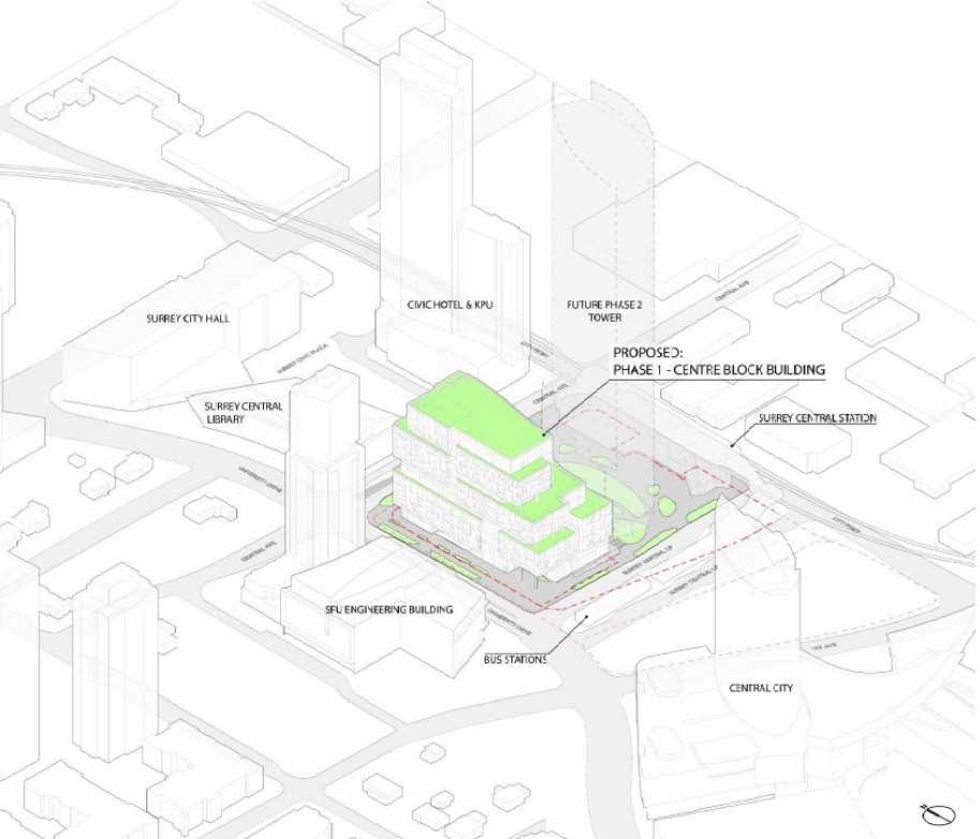 Centre Block and its surrounding context. (Stantec-Revery, SCDC)
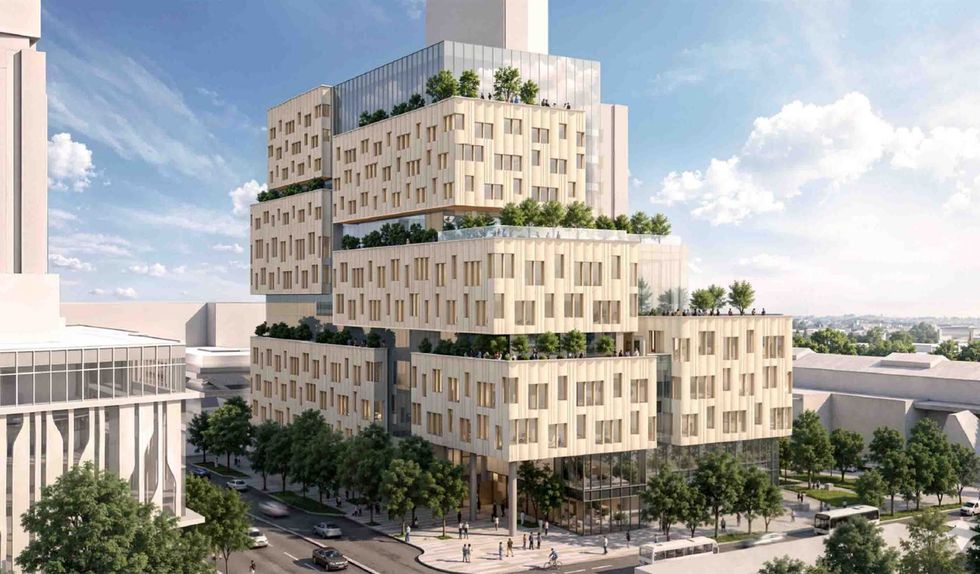 The 12-storey Phase One of Centre Block. (Stantec-Revery, SCDC)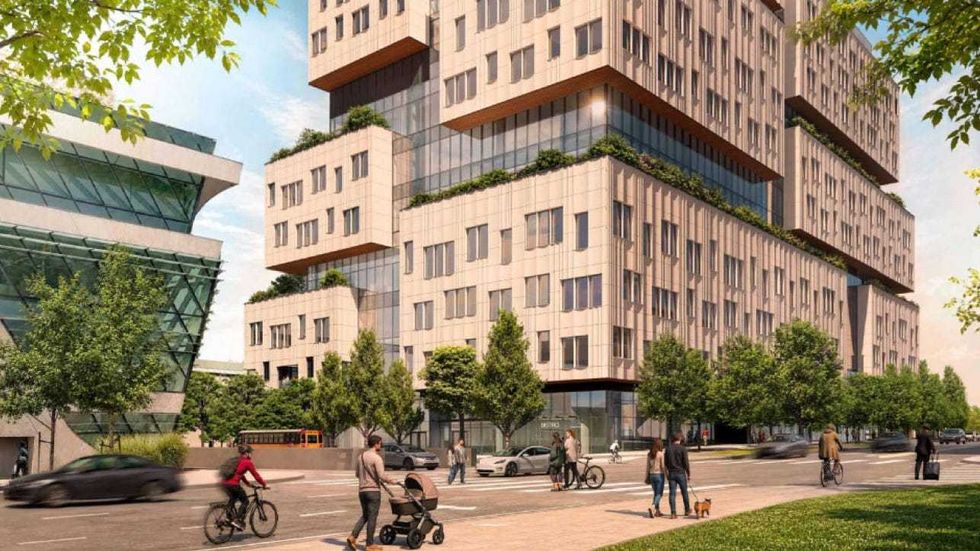
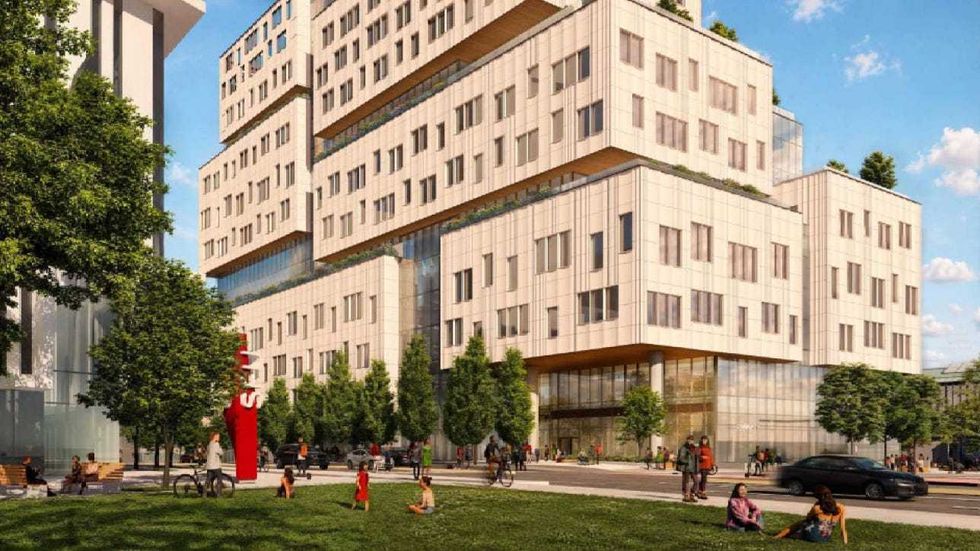 The 12-storey Phase One of Centre Block. (Stantec-Revery, SCDC)
 Mondria One, set for 1607 King Street East in Clarington, Ontario. (ICON Architects Inc., Monde Development Group)