Capitalization Rate
Learn about capitalization rates in Canadian real estate — what they are, how they’re calculated, and why they matter to investors.

August 07, 2025
What is Capitalization Rate?
The capitalization rate, or cap rate, is a measure used to estimate the return on investment for an income-producing property, calculated as Net Operating Income ÷ Purchase Price.
Why Capitalization Rate Matters in Real Estate
In Canadian real estate investing, the cap rate helps investors compare properties and evaluate relative risk.
Key points:
- Higher cap rates generally indicate higher risk and potential return
- Lower cap rates suggest lower risk and higher property value
- Sensitive to changes in income, expenses, and market conditions
Understanding cap rates allows investors to assess property profitability and market trends.
Example of Capitalization Rate in Action
The property sold at a 5% capitalization rate, reflecting its stable cash flow and desirable location.
Key Takeaways
- Indicates expected return on investment property
- Calculated using net operating income and purchase price
- Key metric for investors and appraisers
- Affected by income, expenses, and market conditions
- Helps compare property performance
Related Terms
- Net Operating Income
- Debt Coverage Ratio (DCR)
- Income Approach (Appraisal)
- Market Value
- Vacancy Rate
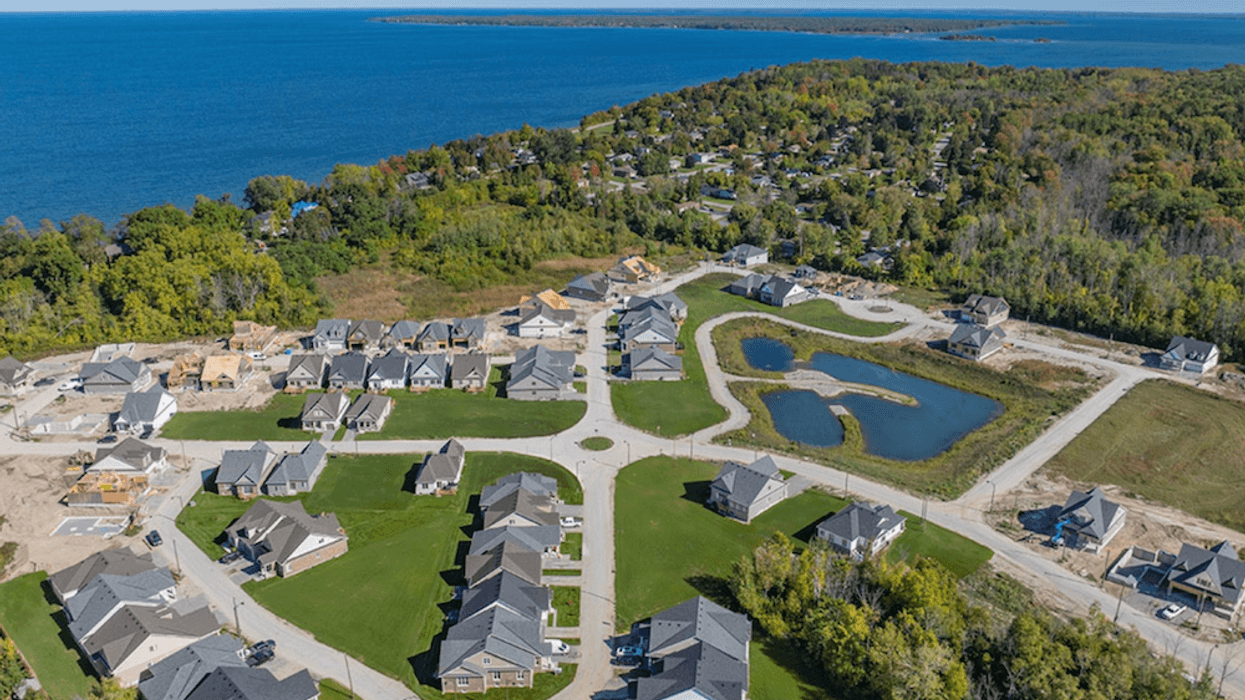
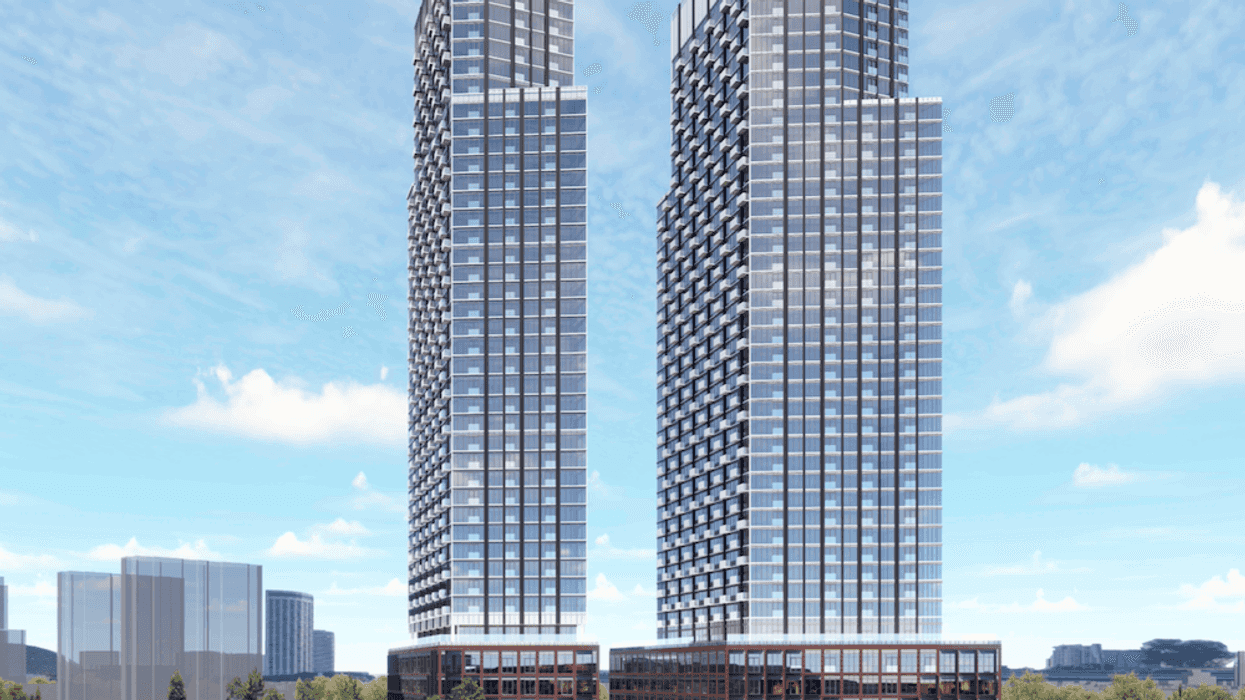
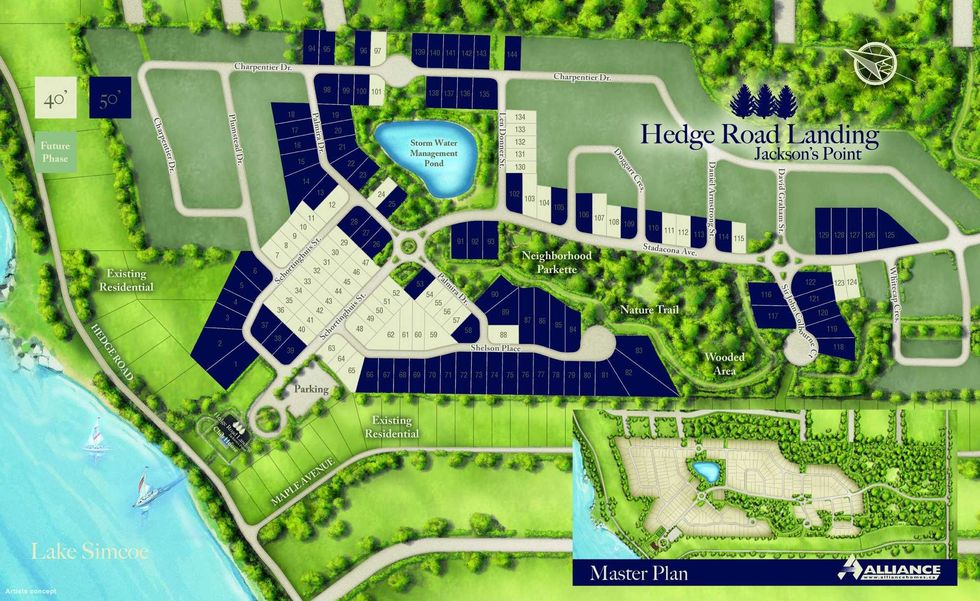 An overview of Hedge Road Landing. (Alliance Homes)
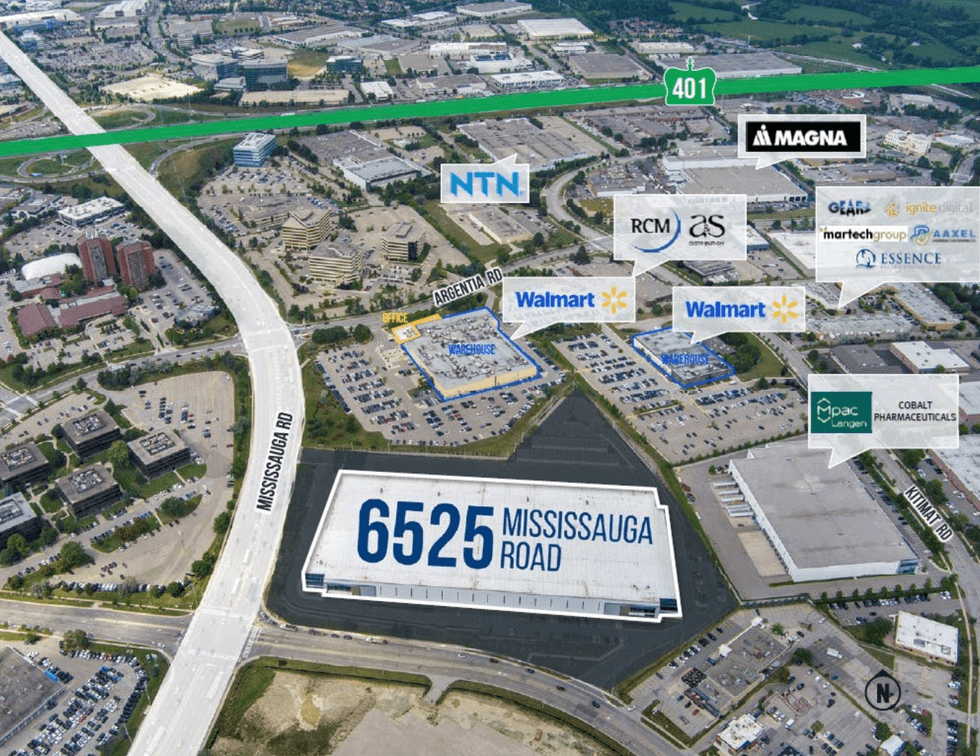 6525 Mississauga Road and its surrounding context. (RBC Capital Markets & CBRE)
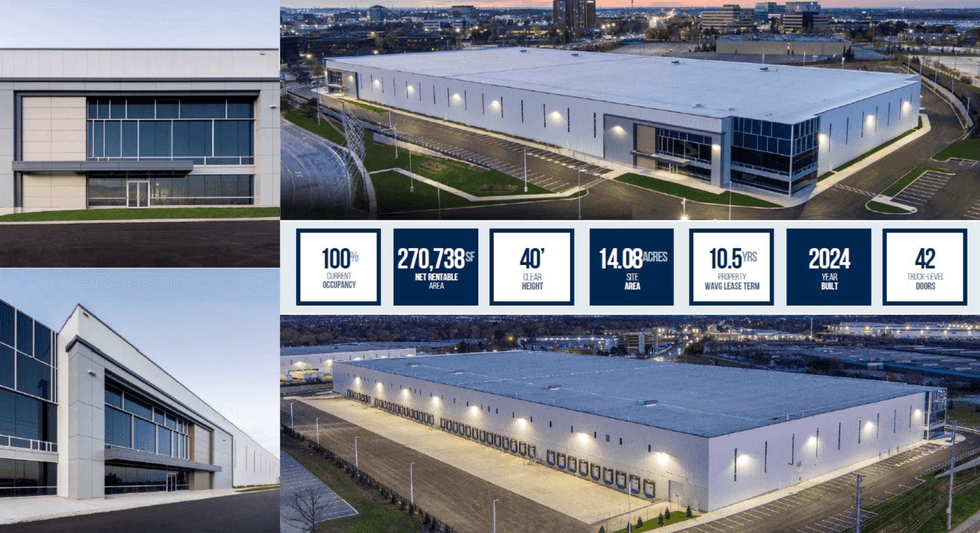 Property details for 6525 Mississauga Road. (RBC Capital Markets & CBRE)


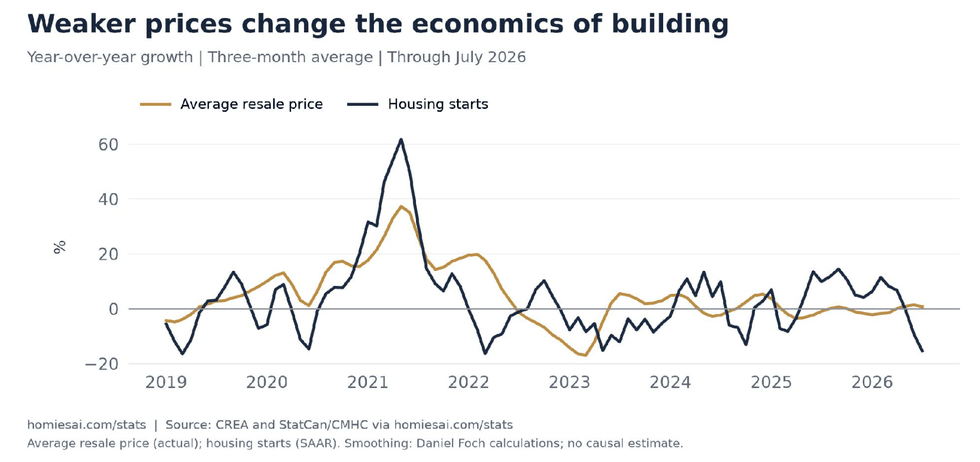 National average resale-price growth and housing-starts growth, smoothed over three months. The comparison illustrates the cycle; it does not establish how much a price change causes construction to change.
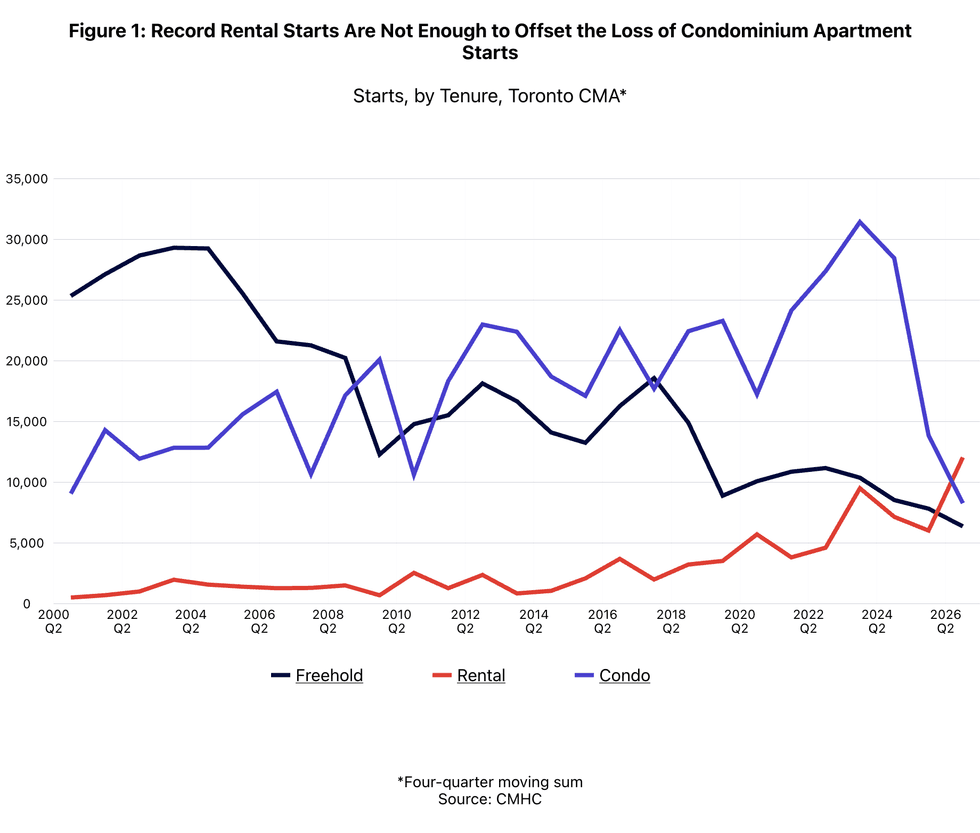
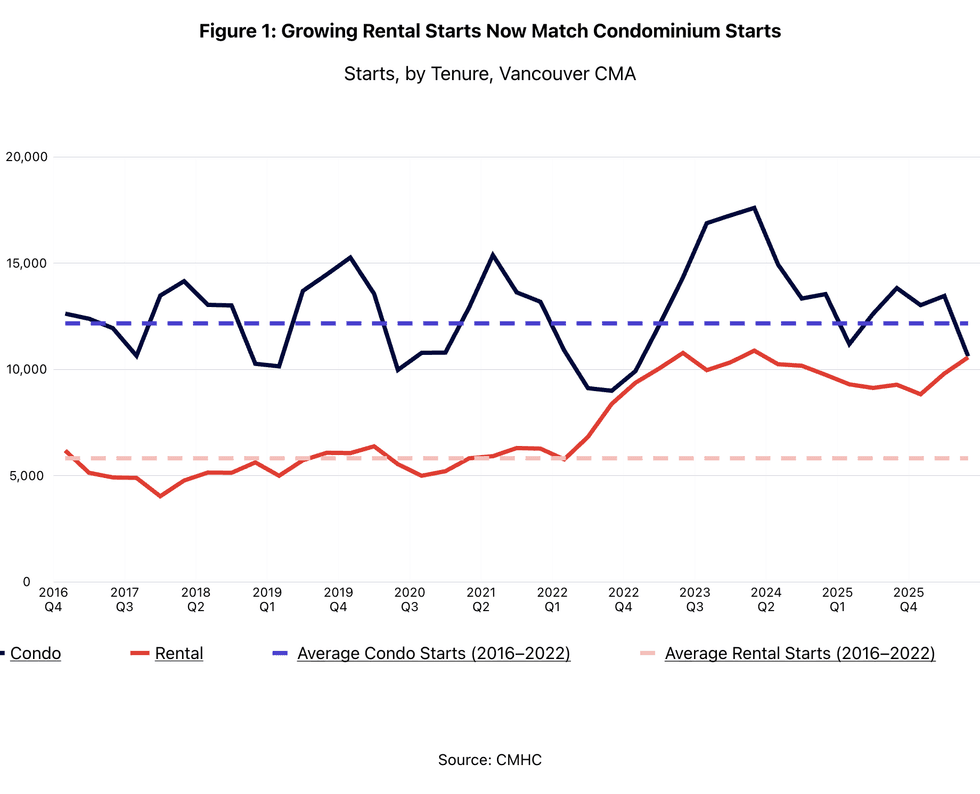
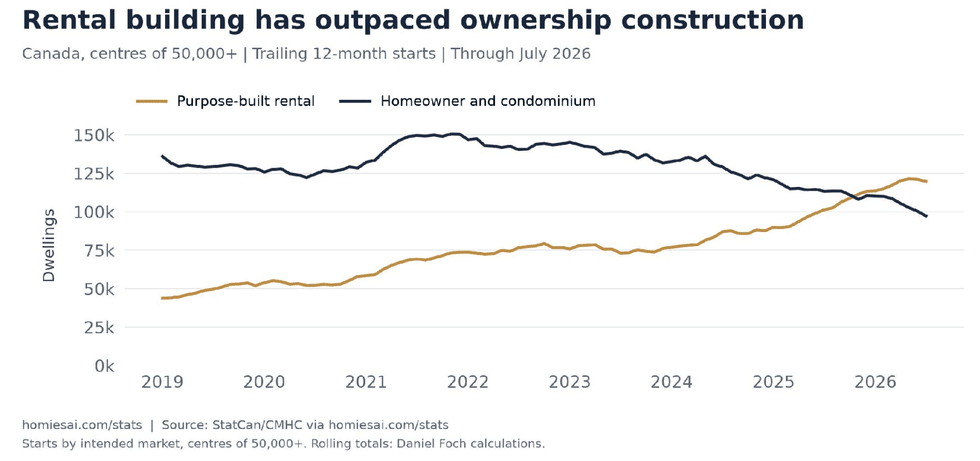 Trailing 12-month starts in centres of 50,000 or more remove the usual monthly seasonality. Ownership combines the homeowner and condominium categories; rental is shown separately.
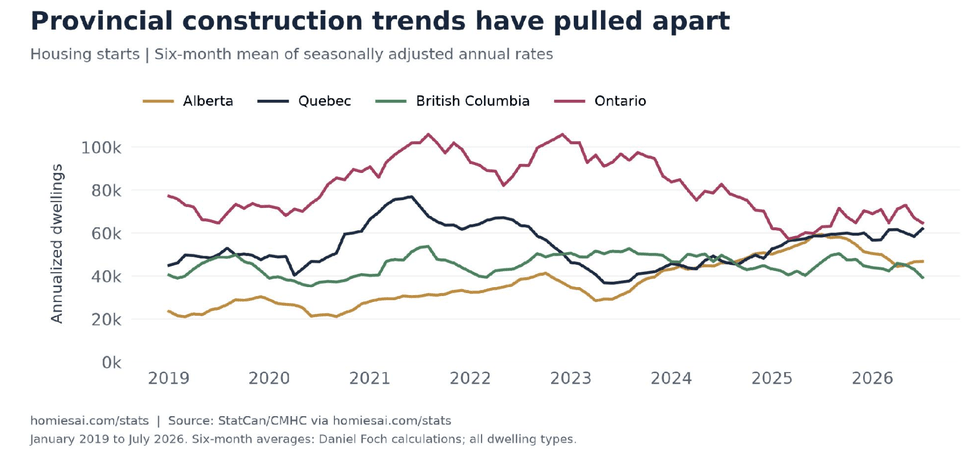 Six-month averages of provincial starts, expressed at annual rates. The smoothing reduces the influence of individual apartment projects.
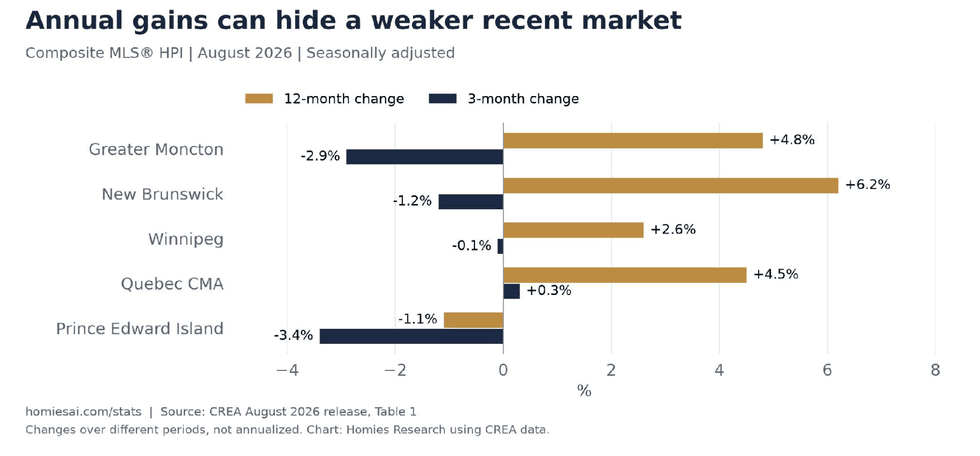 The same August benchmark compared with two different starting points. Three-month changes are not annualized.
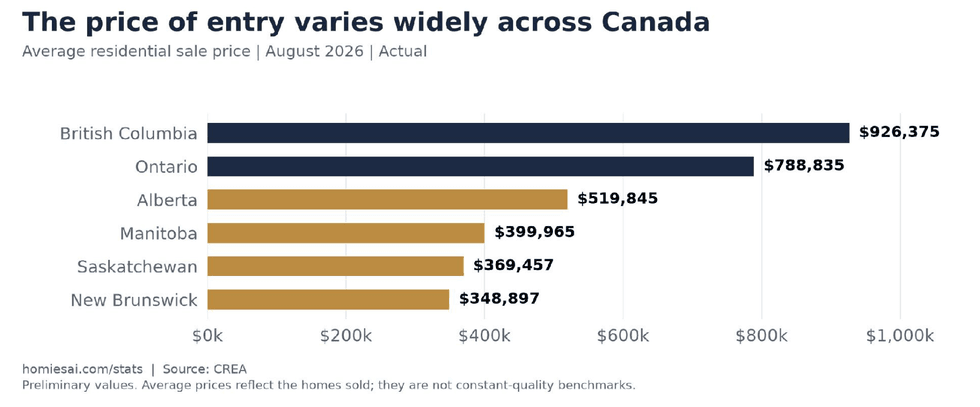 Average sale prices show the difference in purchase costs across markets. They do not measure affordability relative to local incomes or construction costs.
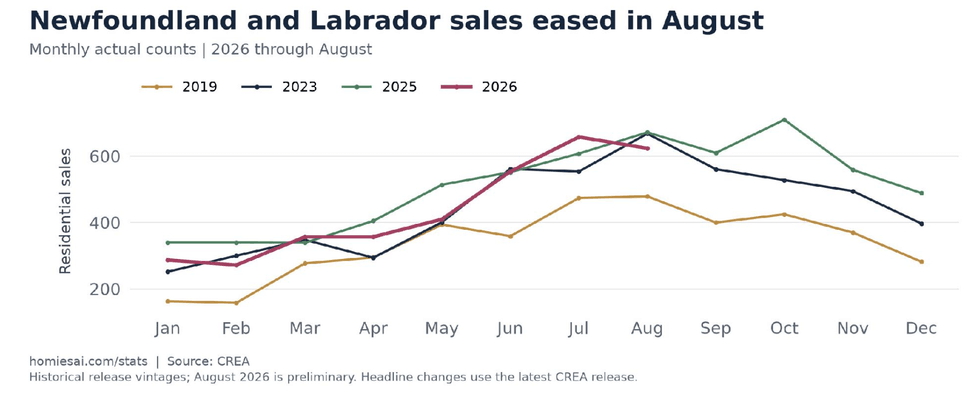 Newfoundland and Labrador remains above its pre-pandemic sales pattern, but August activity was below last year. Historical lines retain their original release vintages.



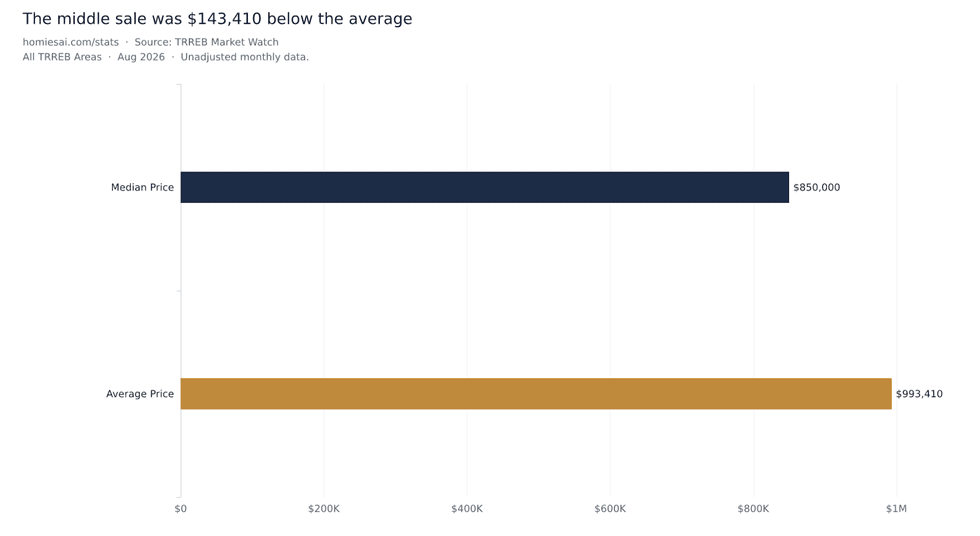 Average and median describe different aspects of the same month’s transactions. Both are affected by the mix of homes sold.
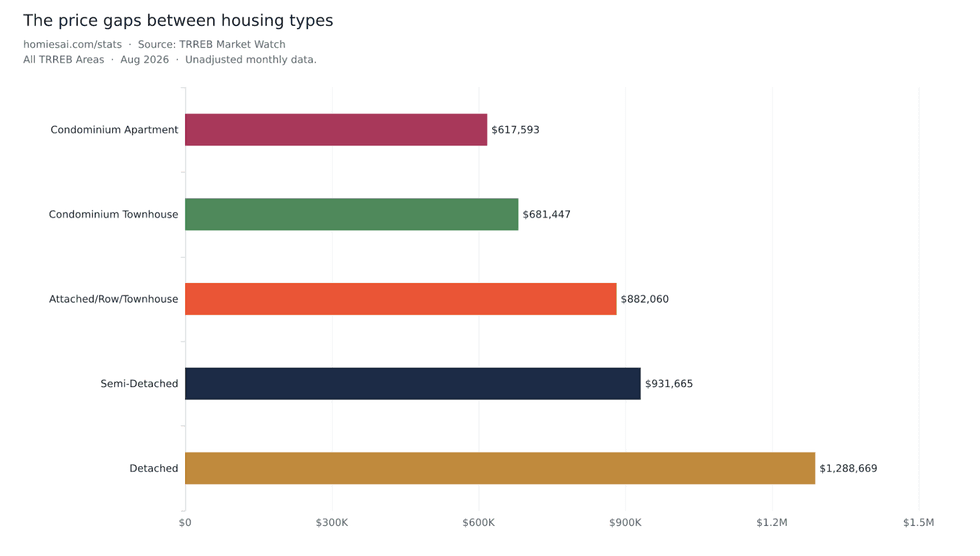 Category averages compare different homes and locations; the gaps are not estimates of the cost to upgrade an otherwise identical property.
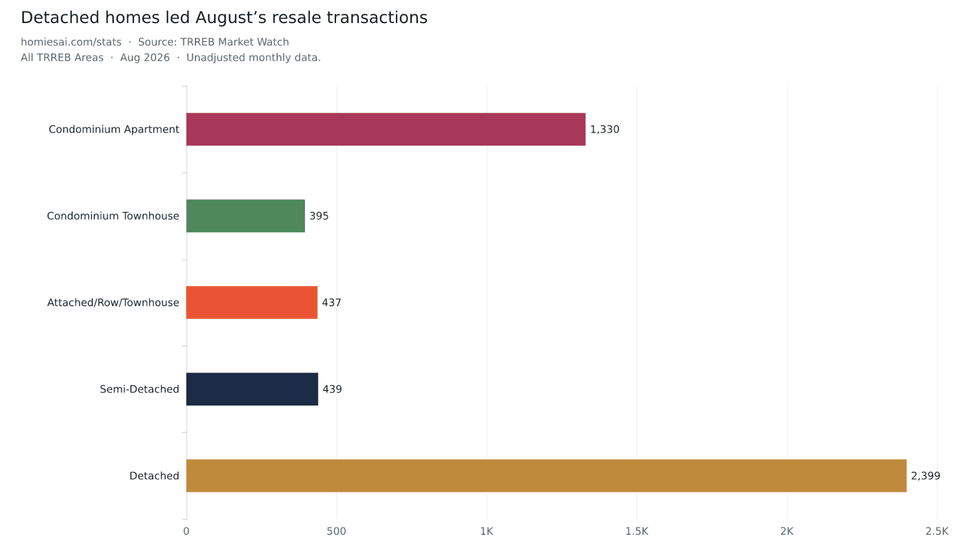 The five categories shown account for 5,000 of the board’s 5,057 sales. The remaining 57 transactions were in other housing categories.
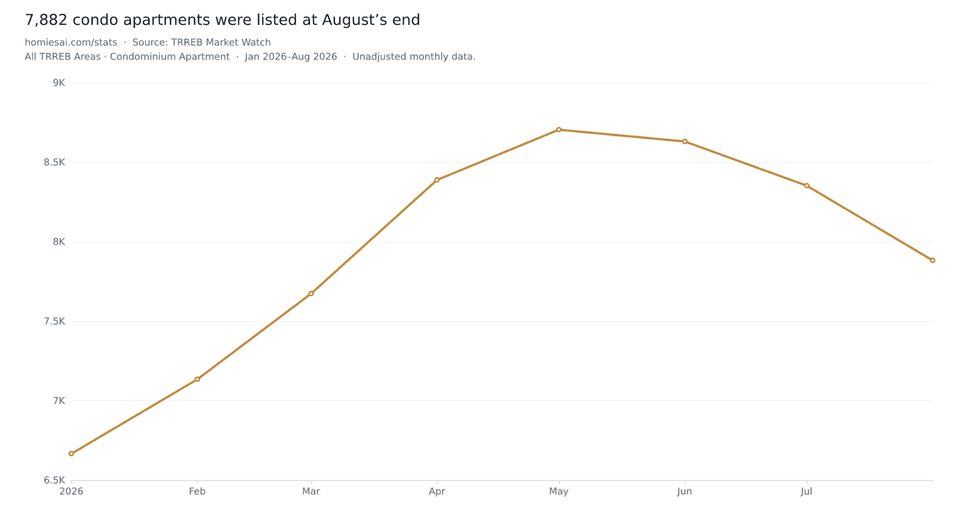 Monthly observations are not seasonally adjusted. Active listings count properties available at month-end; they are not construction inventory.
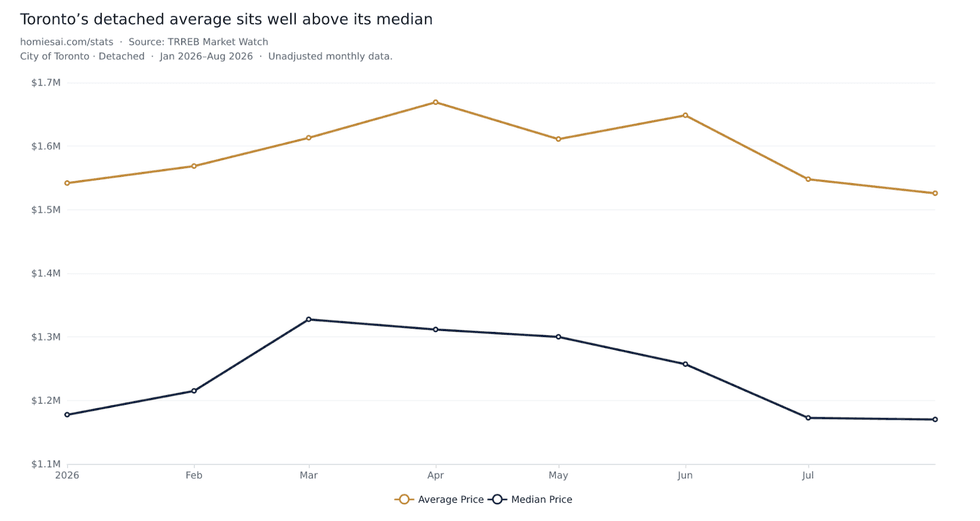 Average and median prices share one dollar axis. These unadjusted transaction measures do not control for changes in the homes sold.
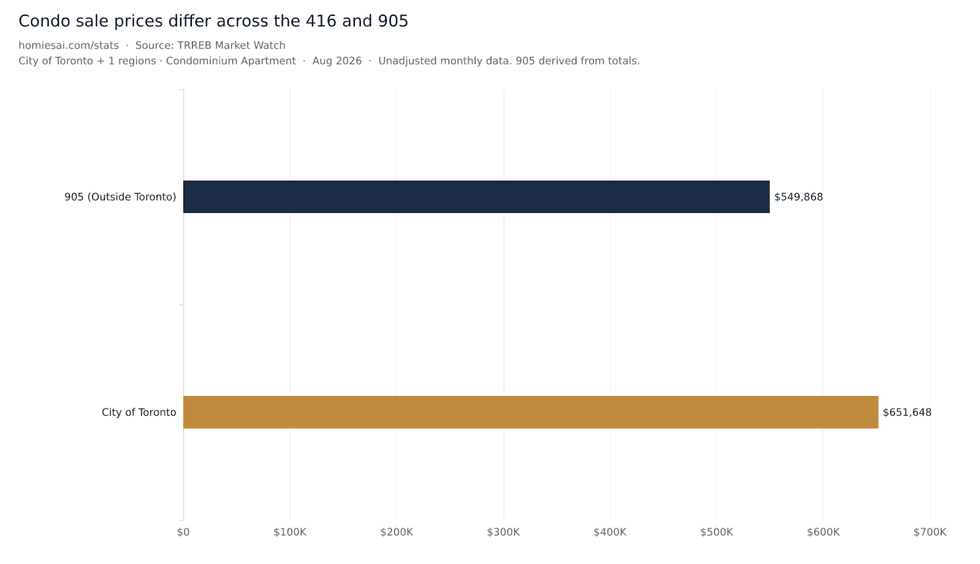 TRREB’s 416/905 categories compare the apartments sold in each area. The difference does not isolate a location premium for equivalent units.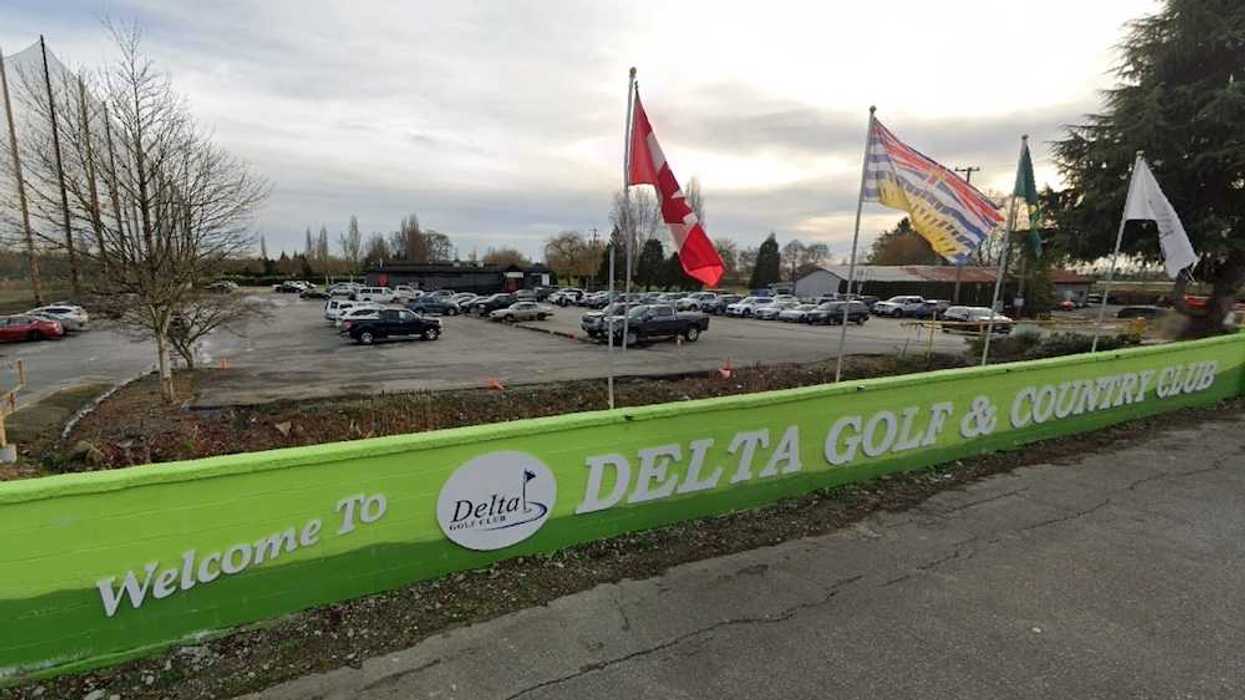
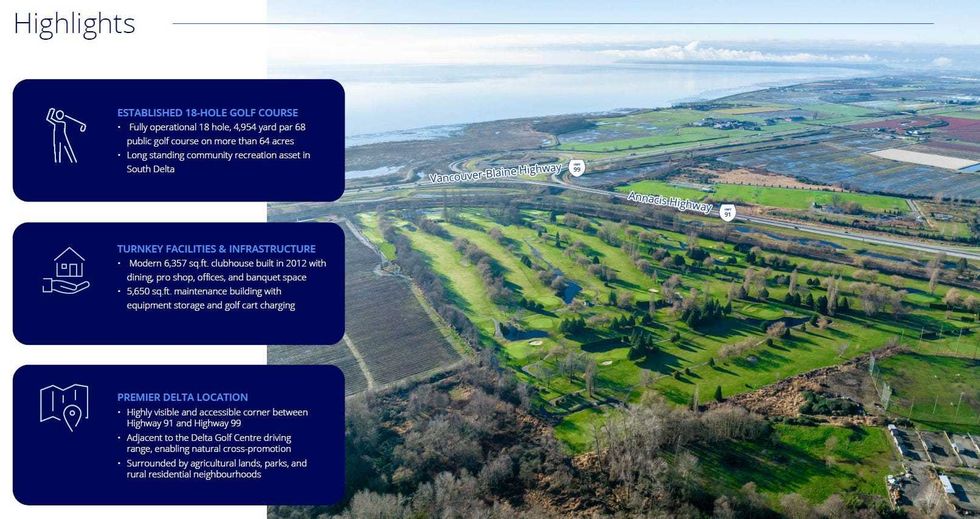 Highlights from the Delta Golf & Country Club listing brochure. (Colliers)