The GTA’s average resale price was $993,410 in August. For a household deciding what to buy, the more useful numbers were $617,593 for a condominium apartment, and $1,288,669 for a detached home.
That is a $671,076 gap between the two category averages. It helps explain why a softer housing market can feel quite different to a first-time condo buyer and a family looking for a detached house. Falling prices do not necessarily bring the next housing type within reach.
The Toronto Regional Real Estate Board’s August Market Watch report put the overall average price 2.7% below a year earlier. The median sale price was lower still, at $850,000. The median marks the middle of the month’s transactions; expensive sales can pull the average upward. Neither figure describes the price of a particular home.
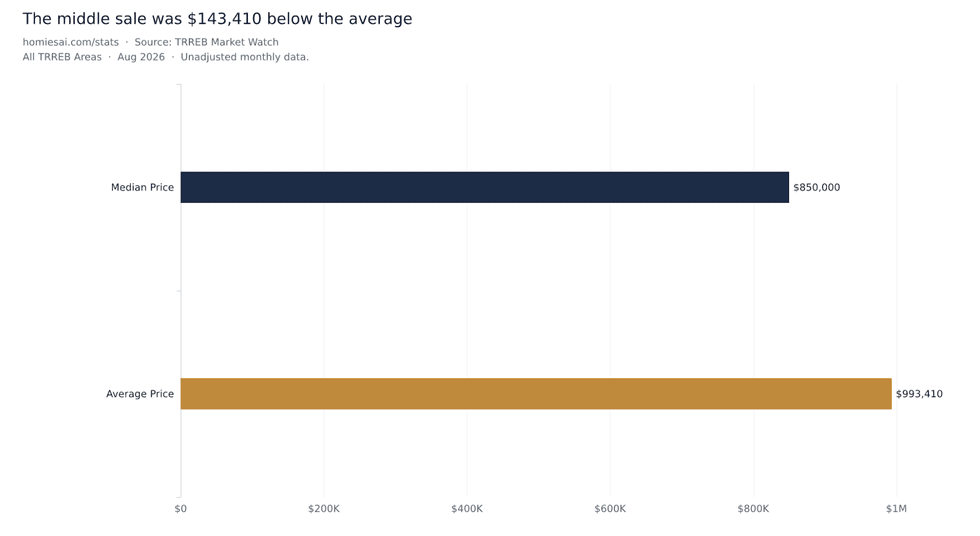 Average and median describe different aspects of the same month’s transactions. Both are affected by the mix of homes sold.
The steps between housing types
Between apartments and detached houses, August’s average prices were $681,447 for condo townhouses, $882,060 for attached and row townhouses, and $931,665 for semi-detached homes. The distinction between the two townhouse categories matters: grouping them together conceals a $200,613 difference in their average selling prices.
TRREB’s price-band table makes the difference more concrete. There were 1,058 condo apartment sales below $700,000 in August, compared with 182 detached sales below that threshold. Lower-priced houses did sell, but the completed transactions at that budget were much more concentrated in apartments. The comparison is useful for setting a search budget before narrowing it to a neighbourhood and a suitable home.
These are averages of different homes in different locations. They do not tell us what a buyer would pay for an extra bedroom, a backyard, or a change in ownership structure on the same street. They do show why a broad claim that townhouses are becoming affordable needs a more precise definition of the product and the buyer.
A household comparing a condo townhouse with a freehold alternative also has to compare the costs of ownership. The purchase price alone leaves out condominium fees, maintenance obligations and property-specific expenses. A lower selling price can make the down payment easier to assemble without producing an equivalent reduction in monthly costs.
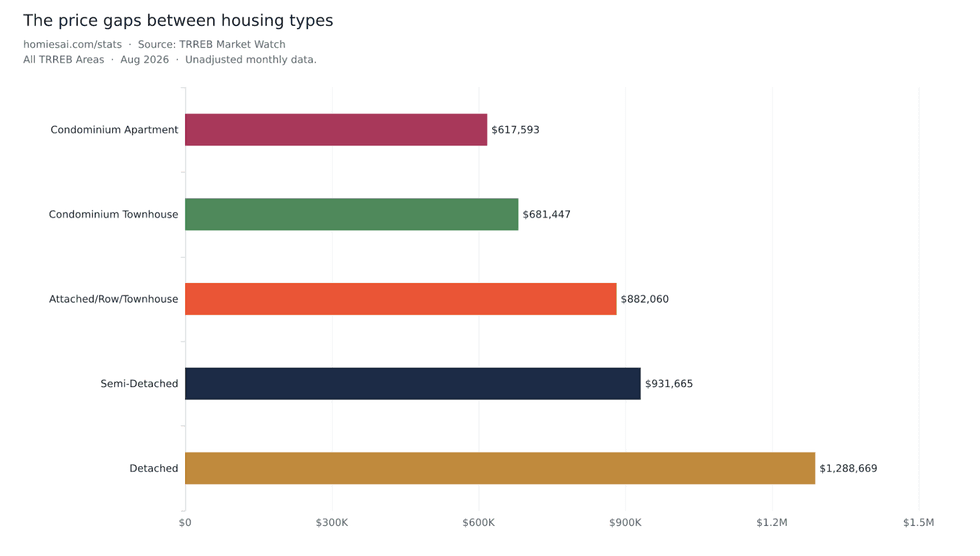 Category averages compare different homes and locations; the gaps are not estimates of the cost to upgrade an otherwise identical property.
Lower prices do not determine what sells
Detached homes accounted for 2,399 of August’s 5,057 sales, or 47.4%. Condo apartments recorded 1,330 sales, or 26.3%. Semi-detached homes, attached and row townhouses, and condo townhouses each recorded fewer than 440 sales.
The most expensive major category still produced the most transactions. That does not establish that buyers prefer detached homes at any price. The number and location of existing homes, the properties offered for sale and the budgets of active buyers all shape the result. Sales counts are completed transactions, not a survey of what households would choose if money were no object.
For developers, that is a reason to be specific about a target purchaser. A project’s unit count cannot be justified simply by pointing to a large pool of households that need housing. Its price and layout have to fit the households able and willing to buy it. The resale record offers one check on those assumptions.
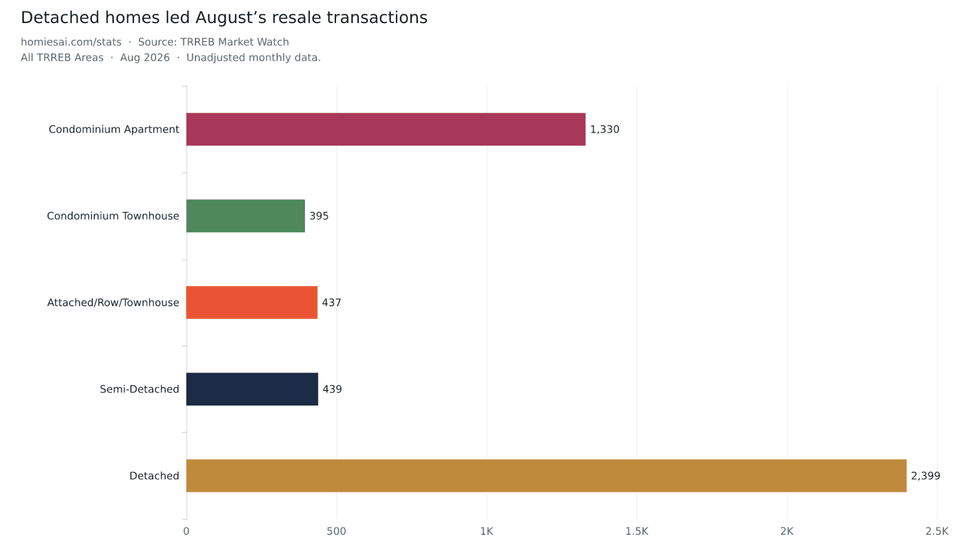 The five categories shown account for 5,000 of the board’s 5,057 sales. The remaining 57 transactions were in other housing categories.
Apartments still offer considerable choice
There were 7,882 condo apartments listed for sale across TRREB’s coverage area at the end of August. Apartments represented 32.2% of all active listings, compared with their 26.3% share of the month’s sales.
Those shares describe a larger concentration of apartments among available listings than among completed deals. They do not measure the chance that an individual listing will sell. Active listings are a count at month-end; sales cover the month, and properties enter and leave the market throughout it.
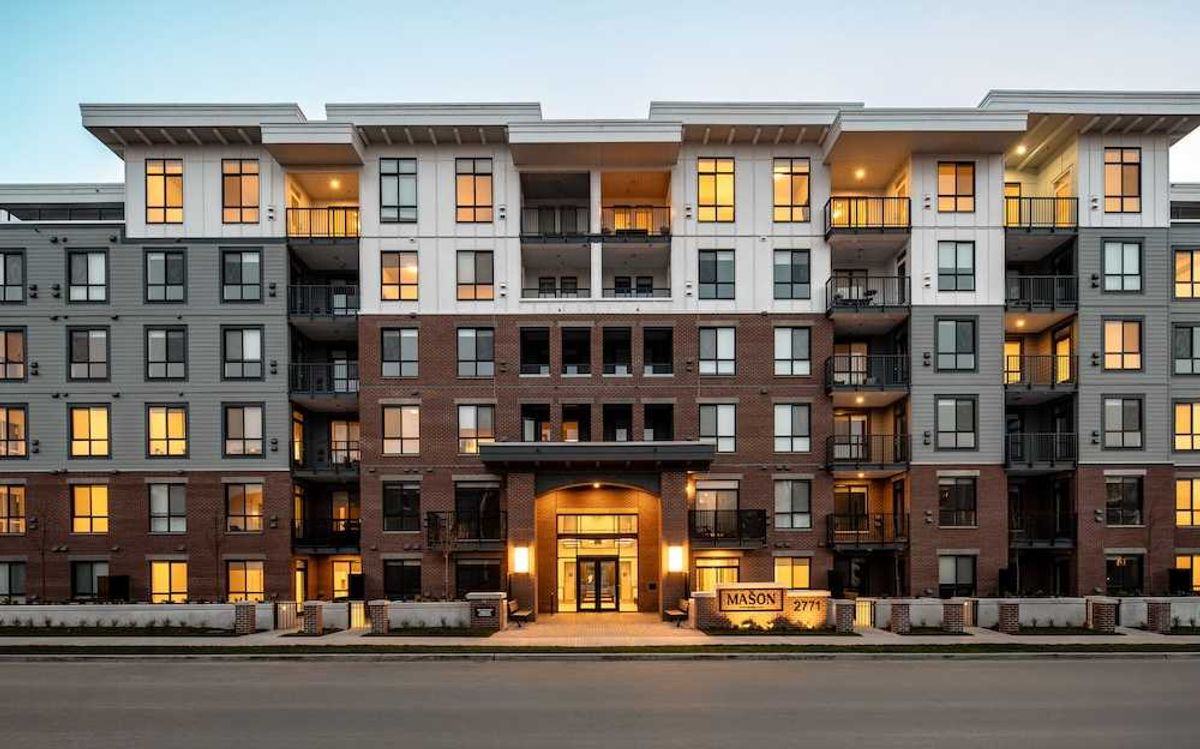
The practical implication for a new condominium project is the range of existing apartments its buyers can inspect. A new unit can offer features an older building lacks. Its premium still needs to make sense beside the size, location, condition and carrying costs of the available resale alternatives. August’s regional average cannot settle that comparison.
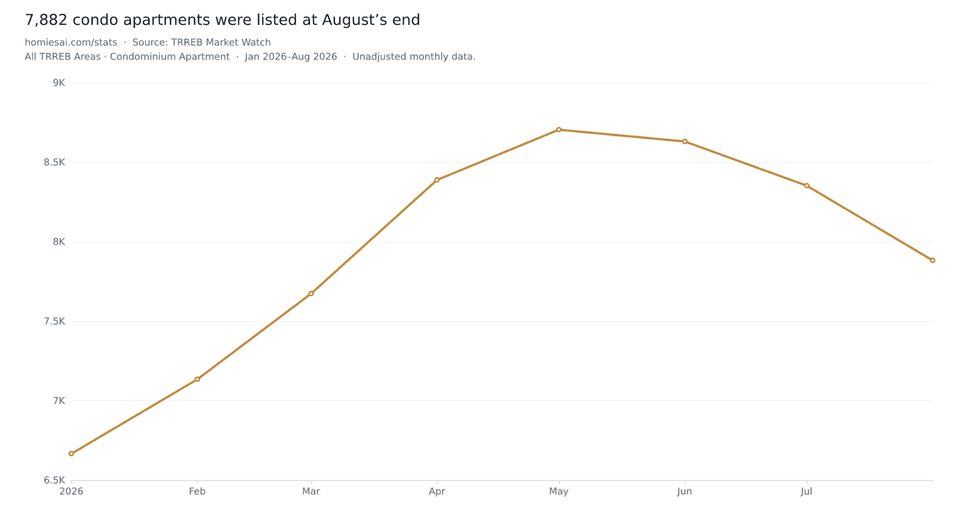 Monthly observations are not seasonally adjusted. Active listings count properties available at month-end; they are not construction inventory.
Even a detached-house average needs context
Within the City of Toronto, detached homes sold for an average of $1,525,749 in August. The median was $1,170,000, a difference of $355,749. That is a substantial gap within one housing type and one municipality.
A family using the average alone could overestimate what the middle of that month’s detached market cost. A developer using it as a comparable could make the opposite mistake: assuming an ordinary infill home competes directly with the expensive transactions that pull up the average.
The median is useful context, but it is also affected by which homes sell. Neither measure controls for lot size, neighbourhood or renovation quality. Those details become more important as the comparison moves from a regional report to a particular purchase or project.
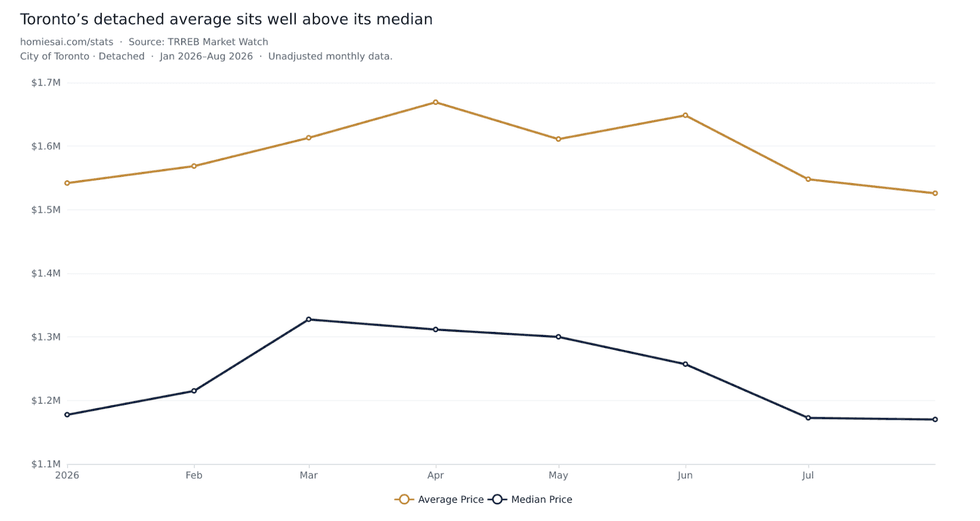 Average and median prices share one dollar axis. These unadjusted transaction measures do not control for changes in the homes sold.
The condo comparison changes outside Toronto
Toronto condo apartments averaged $651,648, compared with $549,868 in the report’s 905 category. The $101,780 difference is a price gap between the apartments that sold in those two areas, not the measured cost of moving an identical unit across the city boundary.
For a buyer able to change location, it is a reason to widen the search and compare actual listings. For a project being priced outside Toronto, it is a reason to test assumptions against nearby resales before borrowing a city-wide price expectation.
Market Watch records resales. It does not tell us how many new units developers presold, whether a project can obtain financing or what it will cost to build. Its value to that industry is more immediate: it shows the prices buyers accepted for existing homes. August’s figures give developers a demanding set of comparisons, and buyers a clearer starting point than the GTA’s sub-$1-million headline.
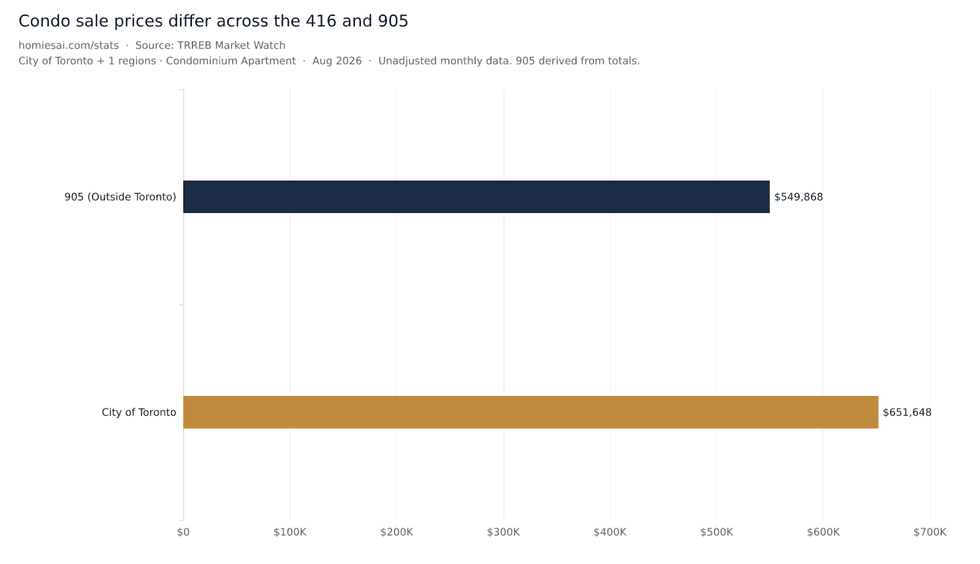 TRREB’s 416/905 categories compare the apartments sold in each area. The difference does not isolate a location premium for equivalent units.
Source: TRREB Market Watch, August 2026. Charts: homiesai.com/stats. Historical charts use each month's stored Market Watch observations, captured for this edition; year-over-year comparisons use the revised figures in the latest report. All charts are not seasonally adjusted.