Canadian homes got cheaper in September. Buyers responded by purchasing fewer of them. A falling price is welcome, but it does little for a household whose mortgage approval no longer covers the home.
There were 36,657 residential sales in September, 7.7% fewer than a year earlier. Sales fell 2.3% from August after seasonal adjustment, so the decline went beyond the usual seasonal change.
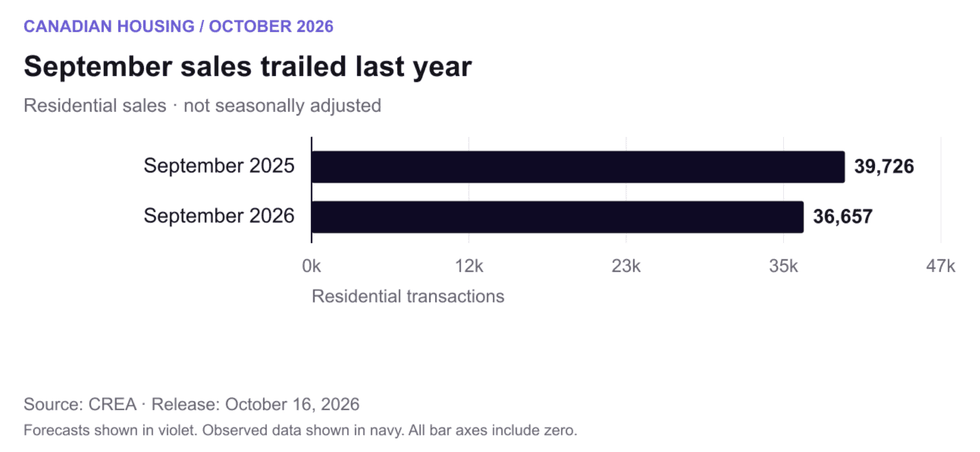 September residential sales, not seasonally adjusted; the annual comparison uses CREA’s revised figures. Chart: valery.ca · Data: CREA.
The national benchmark price fell 0.4% during September and was 3.4% below a year earlier. The average sale price fell 1.6% annually to $666,538. The benchmark tracks comparable housing attributes; the average also changes with the mix of homes sold.
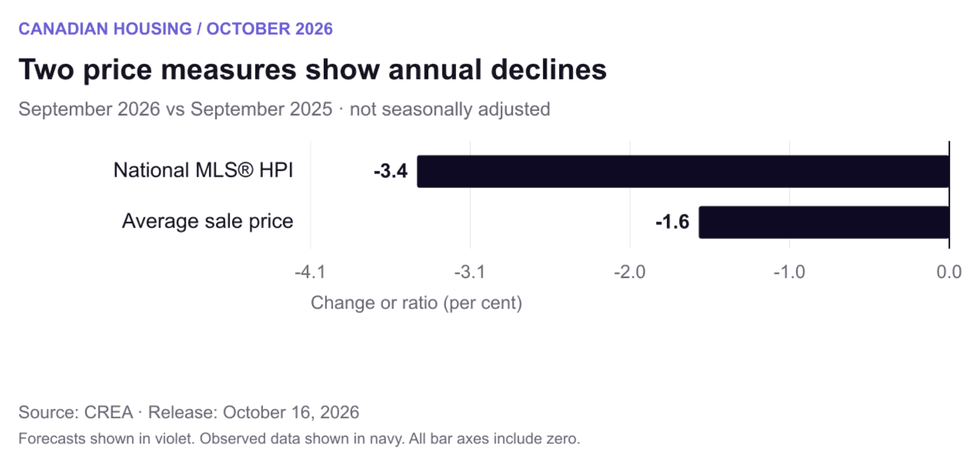 Annual changes in the unadjusted national MLS® HPI and average sale price. The average is affected by the mix of transactions. Chart: valery.ca · Data: CREA.
A discount can disappear into the mortgage
CREA blames the weaker outlook on another increase in fixed mortgage rates and uncertainty over how far variable rates may rise. Its October forecast points to renewed energy-related inflation risks and a more hawkish Bank of Canada. The assumption of an easy return to cheaper borrowing has become harder to defend.
A buyer can negotiate thousands off the purchase price and still face a payment they cannot carry. How much of the discount survives depends on the mortgage size, rate and amortization. The asking price has come down; the lender has not necessarily become more generous.
There is more scope to negotiate than there was during the boom, but national listings are hardly overflowing. CREA counted slightly more than 200,000 homes for sale at the end of September, up just 1.8% annually and close to the historical norm.
B.C.’s supply problem looks different from Manitoba’s
Canada had 4.9 months of inventory after seasonal adjustment. British Columbia had 7.0 months, Manitoba 2.4, and Saskatchewan 3.4. Ontario was at 4.7. The ratio compares the stock of listings with the current sales pace.
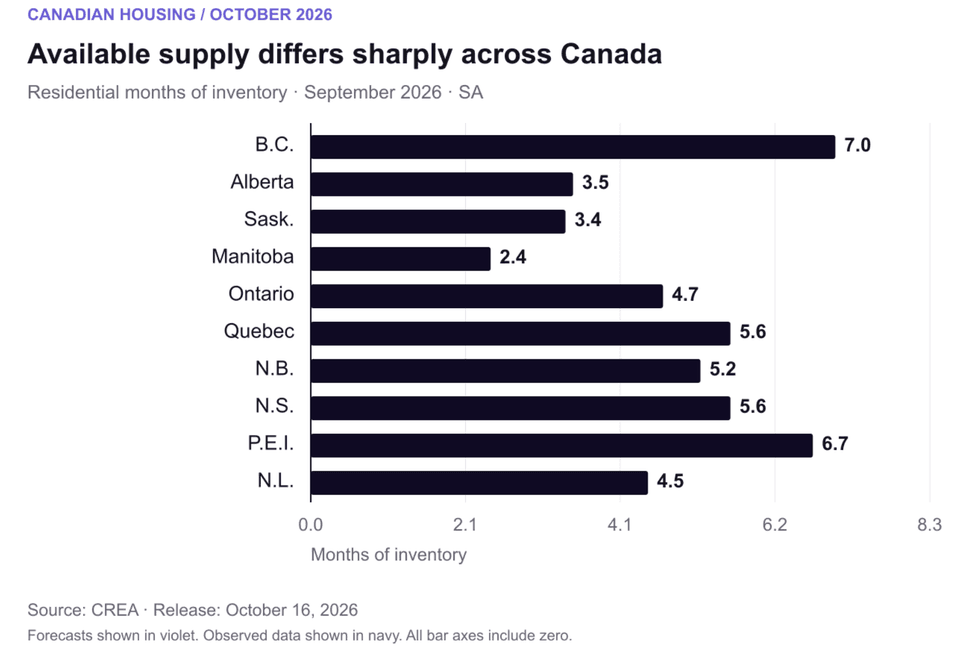 Seasonally adjusted residential months of inventory by province. Local property types can differ substantially. Chart: valery.ca · Data: CREA.
Ontario’s sales-to-new-listings ratio was only 41.9%, even with fewer months of inventory than B.C. The first ratio compares purchases with new listings arriving that month. Months of inventory compares the stock already available with the current sales pace.
A buyer shopping for an apartment can face much less competition than someone looking for a detached home in the same city. Provincial totals are a poor substitute for checking the homes that actually fit the budget.
Ontario is doing worse than the national forecast
CREA forecasts a 0.2% increase in the national annual average sale price to $681,681 in 2026. Ontario’s average is forecast to fall 3% to $809,334, and B.C.’s to fall 0.8%. Gains elsewhere keep the national number slightly positive.
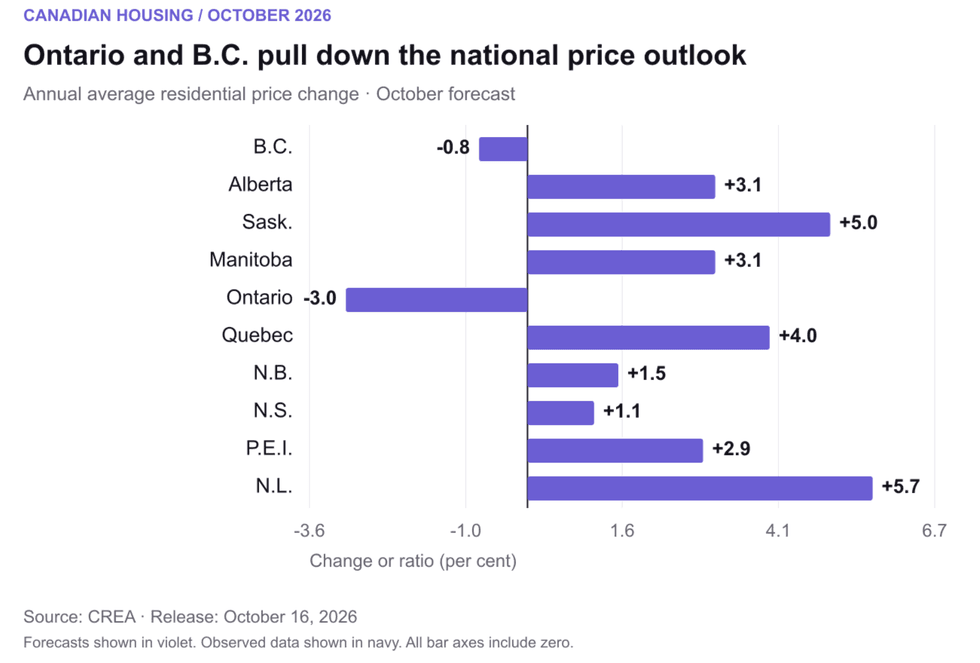 Ontario and B.C. are the two provinces with forecast annual average-price declines in 2026. Chart: valery.ca · Data: CREA.
Newfoundland and Labrador has the strongest expected average-price growth this year at 5.7%, followed by Saskatchewan at 5%. CREA expects both to slow in 2027, to 3.1% and 2.5% respectively.
The national average is projected to reach $689,909 in 2027, up 1.2%. Ontario’s forecast gain is 0.7%, to $815,100. These are nominal annual averages. Ontario’s projected increase next year would recover only a small part of this year’s forecast loss.
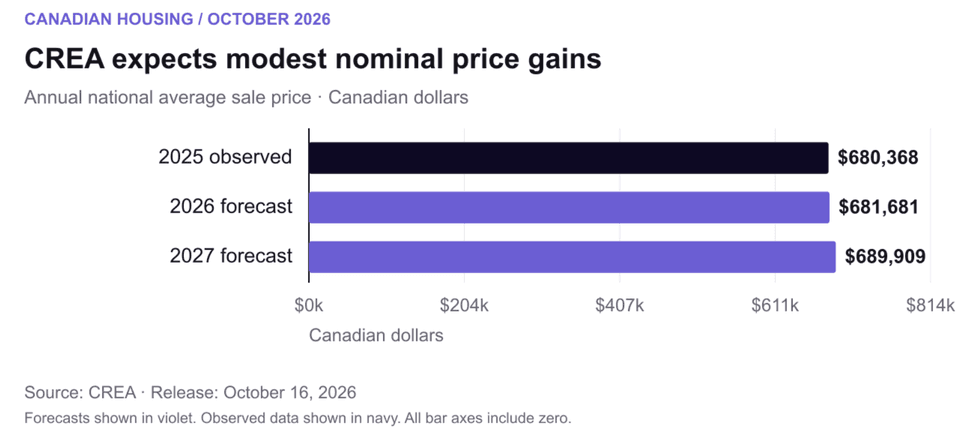 Annual average transaction prices in Canadian dollars. Forecast values are not December price targets. Chart: valery.ca · Data: CREA.
Five years later, parts of Ontario are still cheaper
Greater Toronto’s September benchmark was 14.7% below its September 2021 level. Hamilton-Burlington was down 15.3%. Calgary was 24.6% higher, Quebec City 54.4% higher and St. John’s 41.2% higher. These are seasonally adjusted composite benchmarks measured from September 2021, before the 2022 peak.
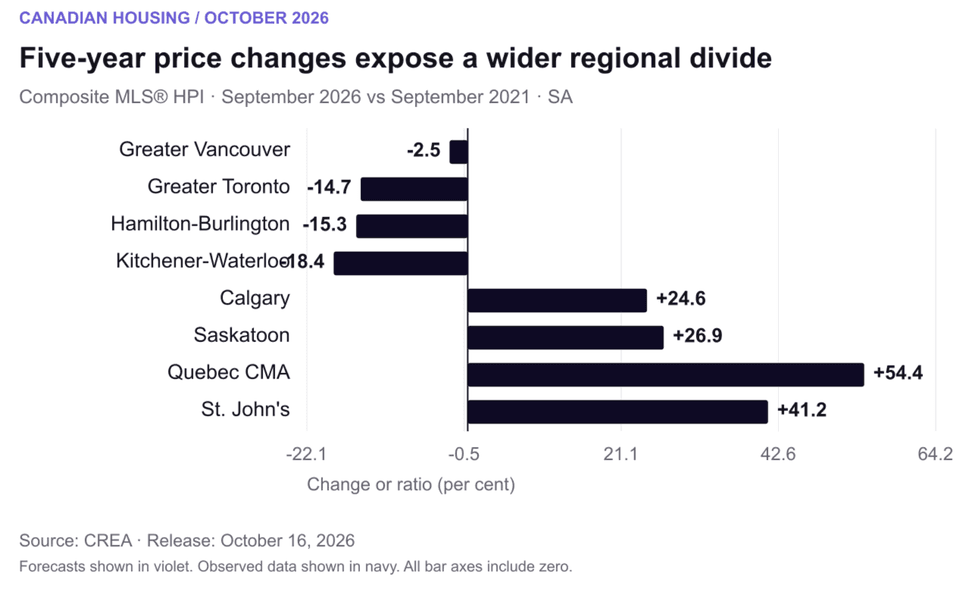 Five-year changes in seasonally adjusted composite MLS® HPI benchmarks, September 2021 to September 2026. Chart: valery.ca · Data: CREA.
For an owner in one of the weaker Ontario markets, waiting has already failed to guarantee a better sale price. Moving can mean accepting less equity than expected while financing the next purchase at a higher rate. That is a good reason for a household to stay put, even when it would rather move.
Developers also have to compete with the prices buyers can pay for existing homes. Softer resale prices can squeeze the revenue available to cover a new project’s costs. CREA’s releases do not track presales, construction costs, or developer balance sheets, so they cannot tell us which projects will proceed.
Pent-up demand still needs a mortgage
CREA now expects 444,530 sales in 2026 and 464,235 in 2027. The forecast rebound of 4.4% would leave annual sales 4,436 below 2025. Even the recovery scenario falls short of that earlier year’s activity.
The confident pitch about pent-up demand has become harder to hear over repeated forecast cuts. CREA still uses the term in its 2027 outlook, but buyers are expected to return after economic growth, renewed population growth and a clearer interest-rate path help them along. Calling demand pent-up does not make it financeable.
That forecast also assumes limited further action by the Bank of Canada. September showed how quickly higher borrowing costs can interrupt a recovery. Buyers may get a better price this fall, but they still have to live with the payment.
CREA’s September 2026 monthly statistics and MLS® HPI package and October 2026 housing forecast, released October 16, 2026. Statistics retain the comparisons and revisions in the supplied media PDFs. Annual forecast prices are nominal transaction averages; forecasts are scenarios, not observed outcomes.
Monthly statistics: https://stats.crea.ca/en-ca/
Quarterly forecasts (October media PDF; July comparison uses the official July 15 vintage): https://www.crea.ca/housing-market-stats/canadian-housing-market-stats/quarterly-forecasts/
Charts: valery.ca · Data: CREA. MLS® and Multiple Listing Service® are CREA trademarks. Independent analysis; no CREA affiliation or endorsement.