Walkability
Learn about walkability in Canadian real estate — how it’s measured, why it matters to buyers, and how it enhances neighbourhood value.
June 23, 2025
What is Walkability?
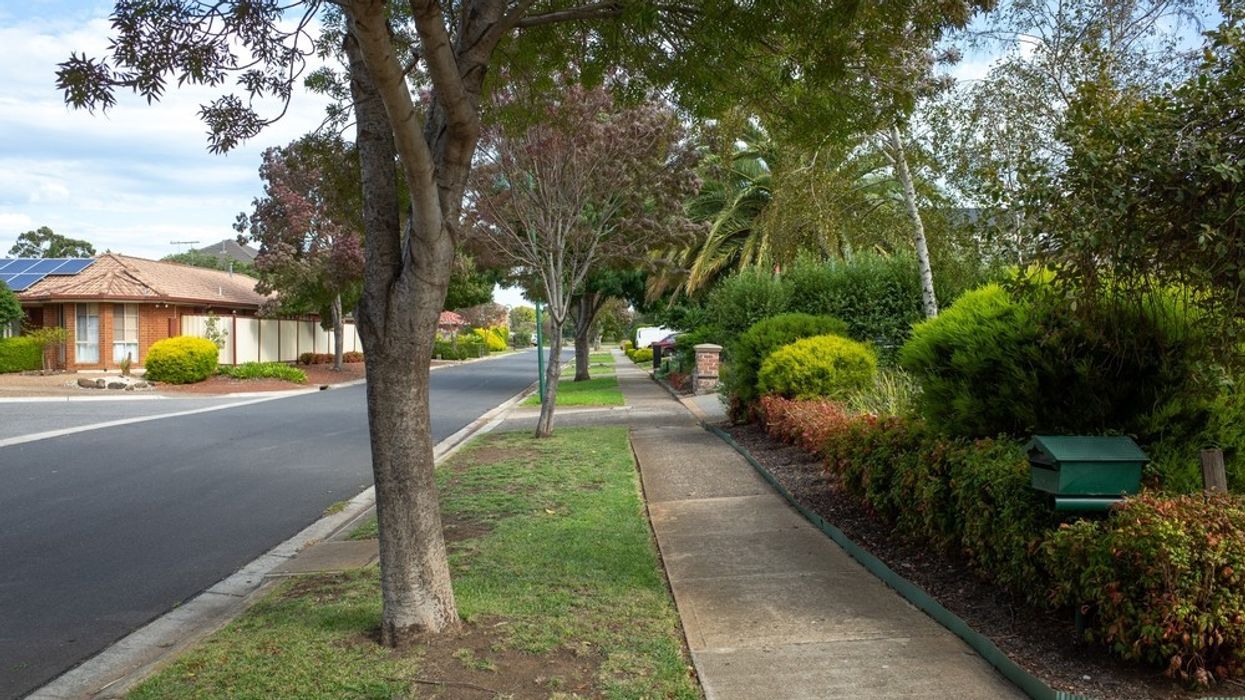
Walkability refers to how friendly an area is to walking, measured by the accessibility of amenities, safety, sidewalk infrastructure, and overall urban design.
Why Walkability Matters in Real Estate
In Canadian real estate, walkability enhances neighbourhood desirability and supports higher property values, particularly in urban centres or transit-adjacent communities.
Factors that influence walkability:
- Proximity to stores, schools, and transit
- Safe pedestrian crossings and sidewalks
- Mixed-use development and street connectivity
- Lighting, landscaping, and traffic calming measures
Walkability scores, such as those provided by Walk Score®, are increasingly used in property listings and development marketing.
Understanding walkability helps homebuyers, renters, and investors evaluate lifestyle, transportation savings, and resale potential.
Example of Walkability in Action
The condo’s high walkability score is a major draw for buyers seeking a car-free lifestyle close to downtown restaurants and transit lines.
Key Takeaways
- Indicates how pedestrian-friendly an area is
- Linked to property value and livability
- Influenced by access to services and transit
- Common in real estate marketing
- Favours car-free or low-commute lifestyles
 (Avison Young)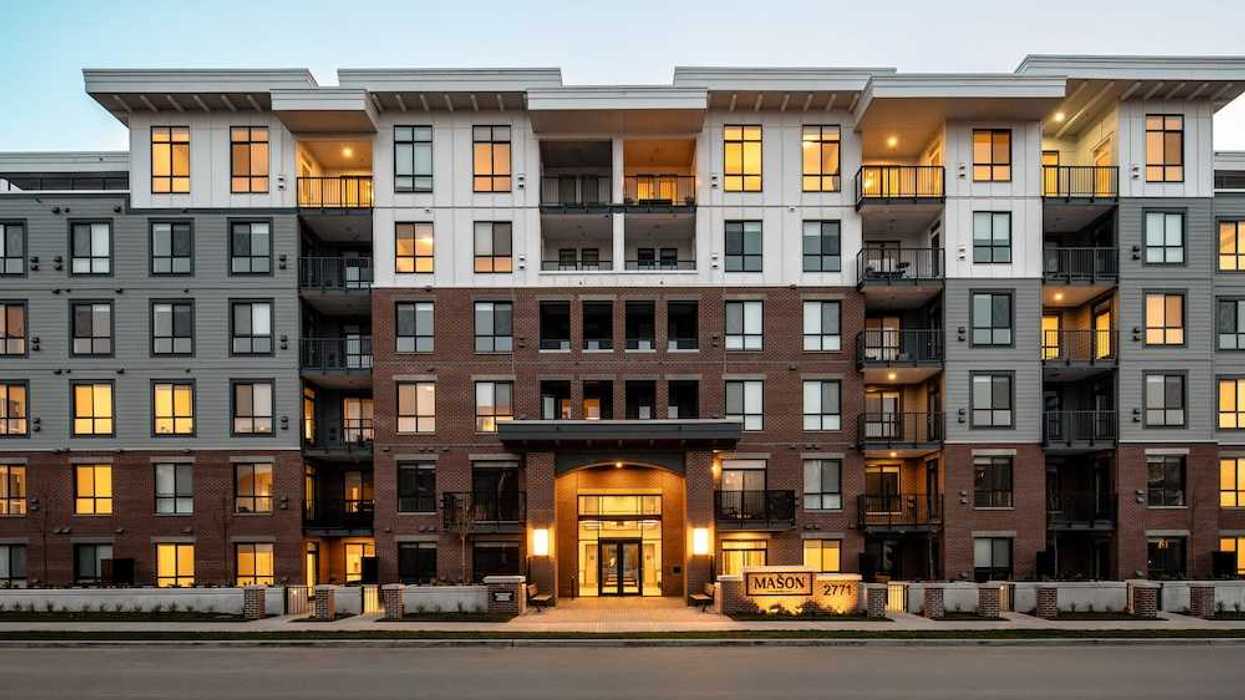
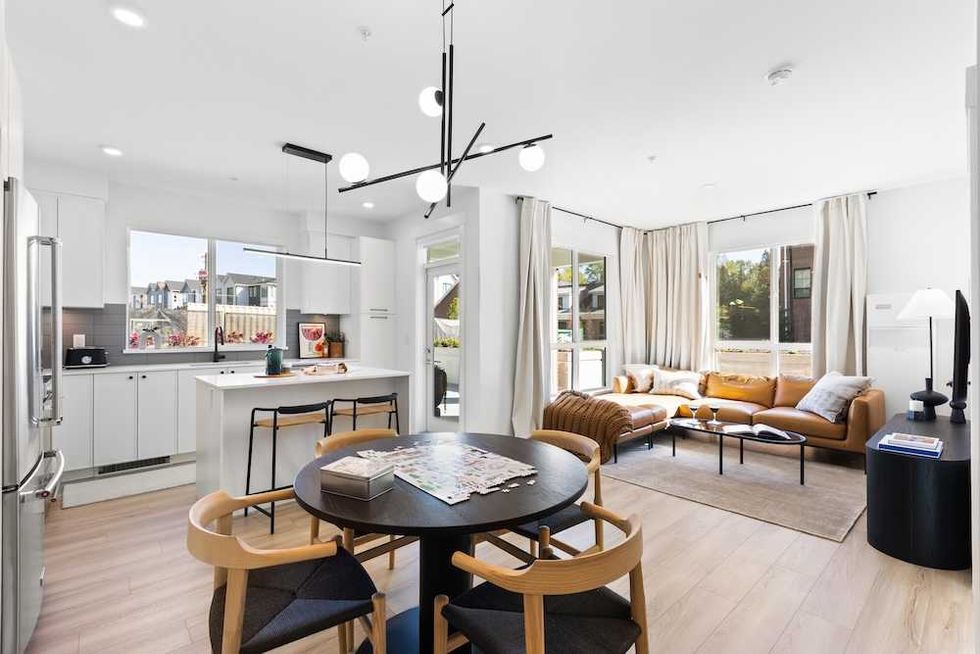 The Mason Suite Interior (Infinity Properties)
 The Mason Suite Interior (Infinity Properties)
 Rail District aerial (Infinity Properties)
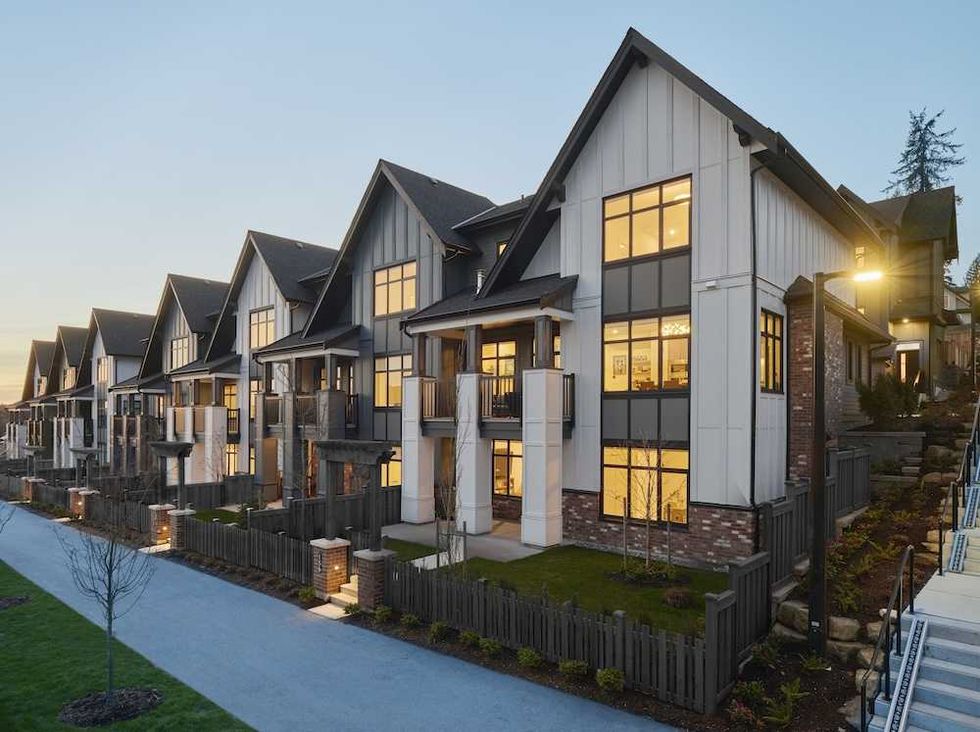 Versant (Infinity Properties)





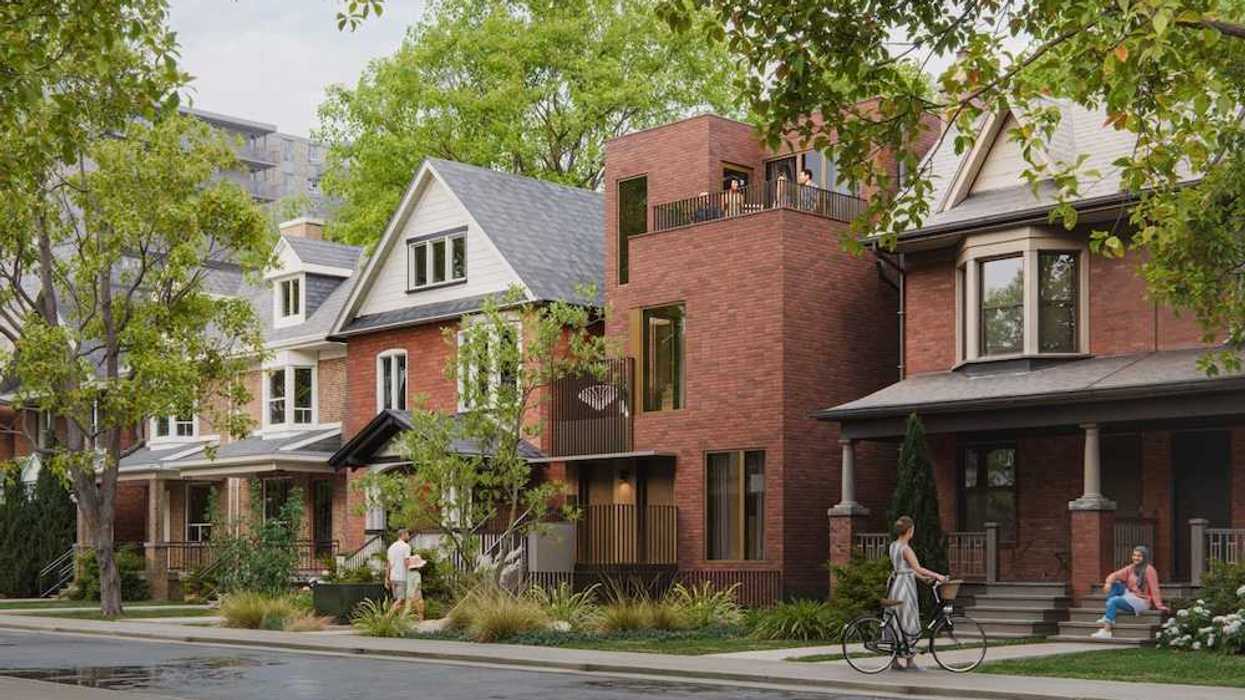
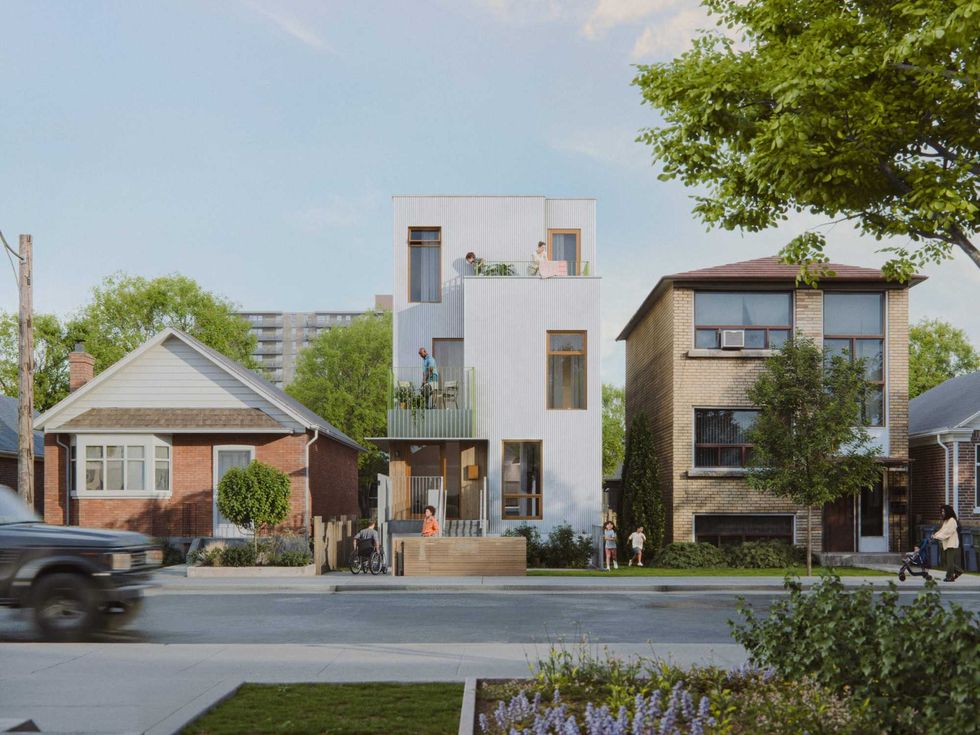 Narrow Fourplex (City of Toronto)
 Wide Sixplex - Side View (City of Toronto)
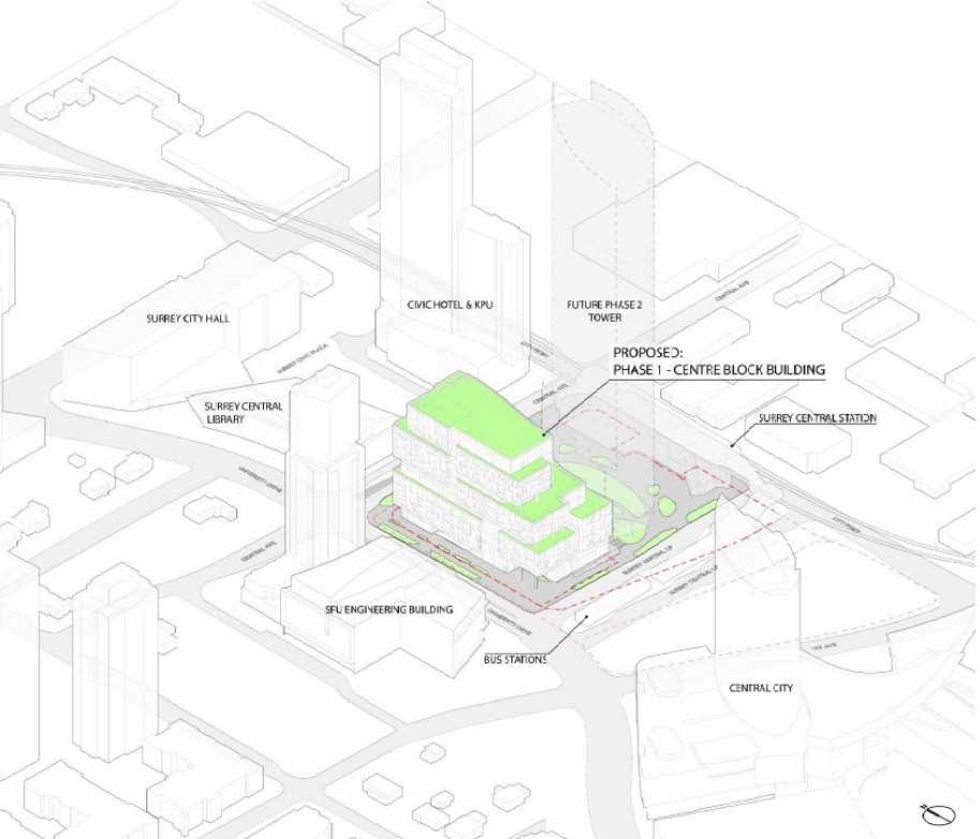 Centre Block and its surrounding context. (Stantec-Revery, SCDC)
 The 12-storey Phase One of Centre Block. (Stantec-Revery, SCDC)
 The 12-storey Phase One of Centre Block. (Stantec-Revery, SCDC)
 Mondria One, set for 1607 King Street East in Clarington, Ontario. (ICON Architects Inc., Monde Development Group)