Loss-to-Lease
Loss-to-lease is the difference between in-place and market rents, showing unrealized revenue potential or over-market exposure.

September 30, 2025
What is Loss-to-Lease?
Loss-to-lease measures the difference between current in-place rents and prevailing market rents. It shows unrealized revenue potential when rents are below market or over-market risk when rents exceed current rates. This metric is often used in multifamily and commercial property analysis.
Why Loss-to-Lease Matters in Real Estate
Loss-to-lease matters in real estate because it directly impacts property valuation, investment strategy, and renewal planning. High loss-to-lease indicates potential for rent growth but also exposes owners to tenant turnover risk. Asset managers use loss-to-lease data to create phased renewal plans that balance growth and retention.
Example of Loss-to-Lease in Action
A multifamily portfolio shows average rents $200 below market. The owner implements a phased renewal strategy to capture higher rents gradually while minimizing turnover.
Key Takeaways
- Loss-to-lease highlights gaps between actual and market rents.
- Indicates revenue growth potential.
- Excessive gaps may increase turnover risk.
- Used in valuations and acquisition underwriting.
- Guides phased rent increase strategies.
Related Terms
- Mark-to-Market
- Rent Roll
- Renewal Strategy
- NOI
- Valuation

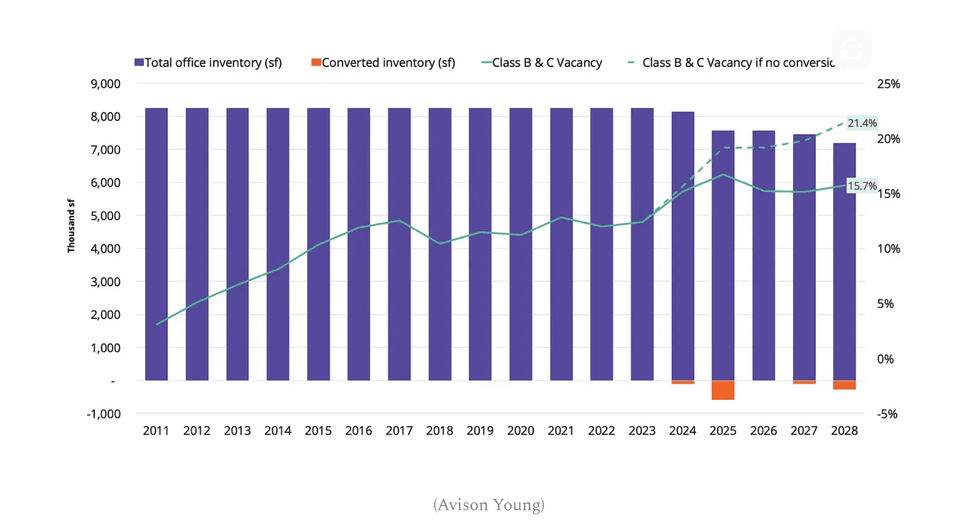 (Avison Young)
 The Mason Suite Interior (Infinity Properties)
 The Mason Suite Interior (Infinity Properties)
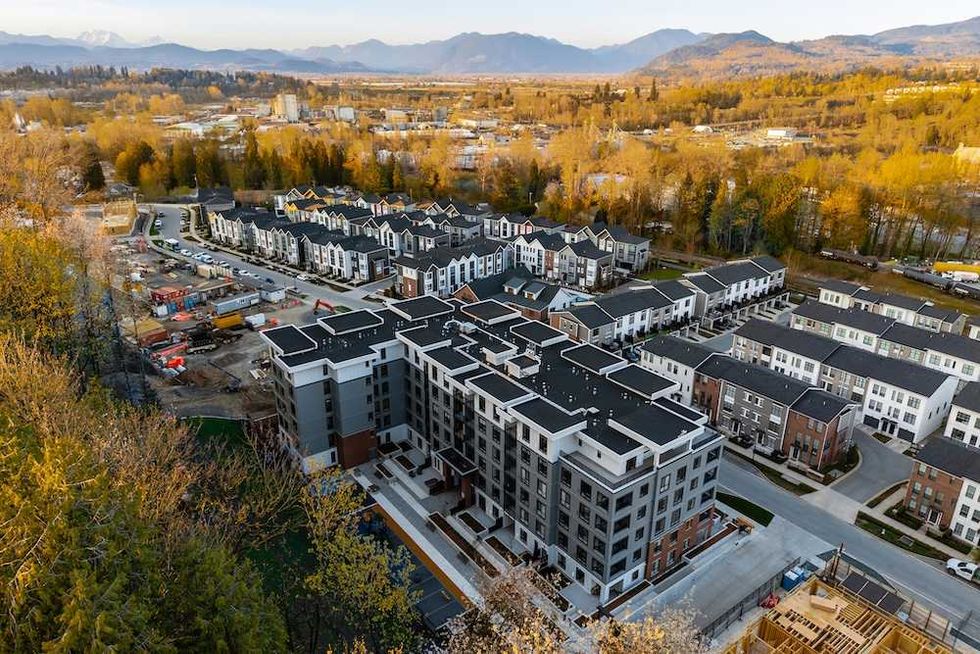 Rail District aerial (Infinity Properties)
 Versant (Infinity Properties)








 Narrow Fourplex (City of Toronto)
 Wide Sixplex - Side View (City of Toronto)
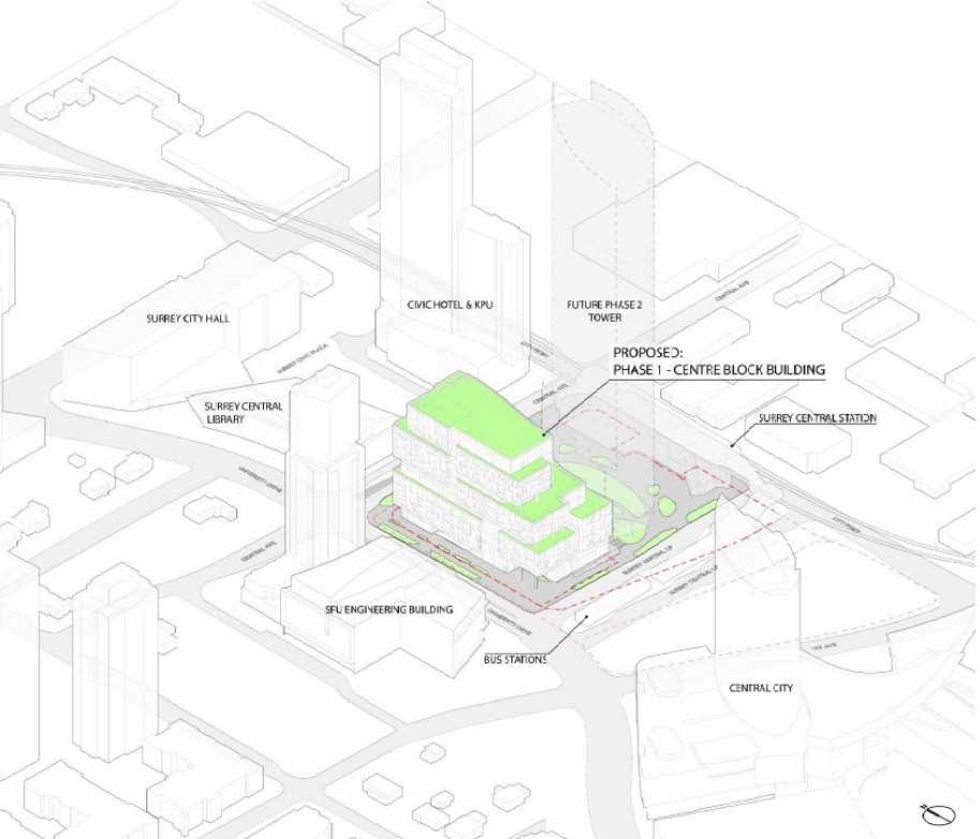 Centre Block and its surrounding context. (Stantec-Revery, SCDC)
 The 12-storey Phase One of Centre Block. (Stantec-Revery, SCDC)
 The 12-storey Phase One of Centre Block. (Stantec-Revery, SCDC)
 Mondria One, set for 1607 King Street East in Clarington, Ontario. (ICON Architects Inc., Monde Development Group)