Gross Debt Service Ratio (GDS)
Understand the Gross Debt Service Ratio (GDS) in Canadian real estate, how it’s calculated, and why it’s essential for mortgage approval and affordability.

May 22, 2025
What is Gross Debt Service Ratio (GDS)?
The Gross Debt Service Ratio (GDS) is a financial metric used by lenders to determine how much of a borrower's income is required to cover housing-related costs.
Why Gross Debt Service Ratio (GDS) Matters in Real Estate
In Canadian real estate, the GDS ratio is one of the key factors used to assess mortgage affordability. It calculates the percentage of a borrower’s gross monthly income that goes toward housing expenses, including:
- Mortgage principal and interest
- Property taxes
- Heating costs
- 50% of condominium fees (if applicable)
The general guideline is that a borrower’s GDS should not exceed 32%. Staying within this threshold ensures that the buyer has sufficient income to manage their housing costs without financial strain.
A low GDS indicates a lower financial risk for lenders and increases the likelihood of mortgage approval. Conversely, a high GDS may signal overextension, prompting lenders to reduce the loan amount or request a larger down payment.
Buyers should calculate their GDS early in the homebuying process to understand what price range they can realistically afford and improve their financial position if necessary.
Example of Gross Debt Service Ratio (GDS)
A couple earns $8,000 per month. Their total monthly housing expenses are $2,400. Their GDS ratio is 30%, which falls within acceptable limits for most Canadian lenders.
Key Takeaways
- Measures how much of your income goes toward housing expenses.
- Lenders typically require a GDS of 32% or less.
- Includes mortgage, taxes, heating, and 50% of condo fees.
- Helps determine mortgage affordability and approval.
- Crucial for budgeting and long-term financial health.
Related Terms
- Total Debt Service Ratio (TDS)
- Mortgage Pre-Approval
- Affordability
- Debt-to-Income Ratio
- Mortgage Qualification
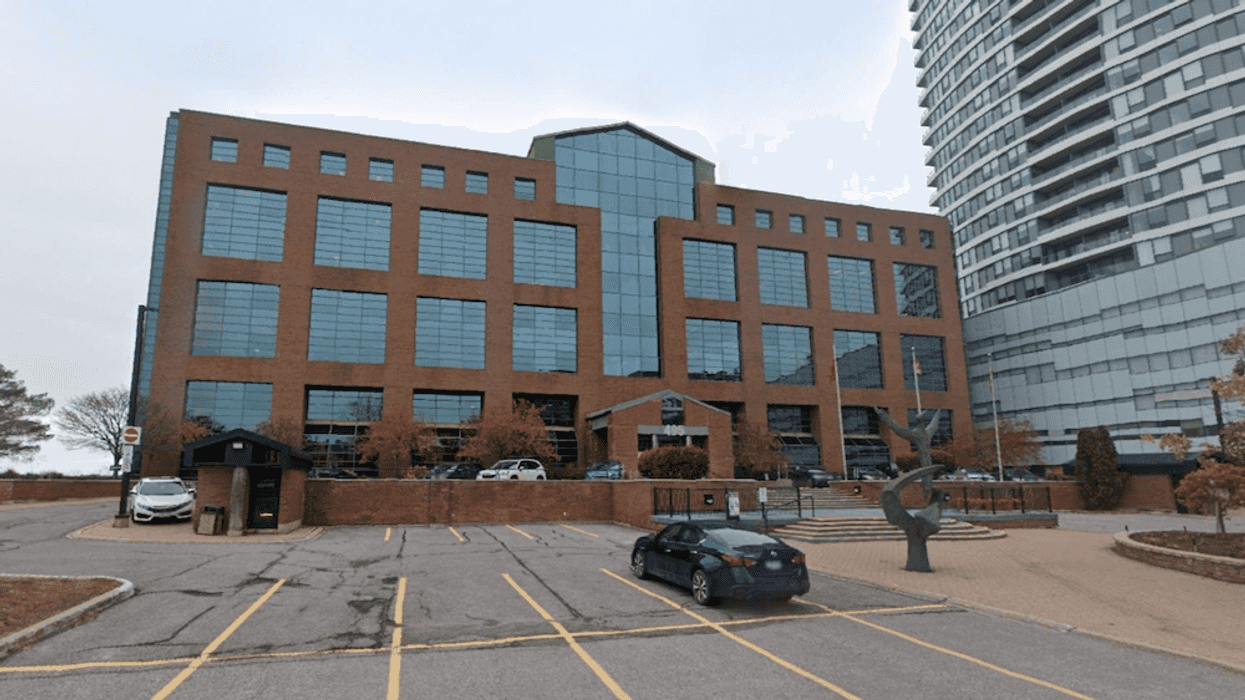
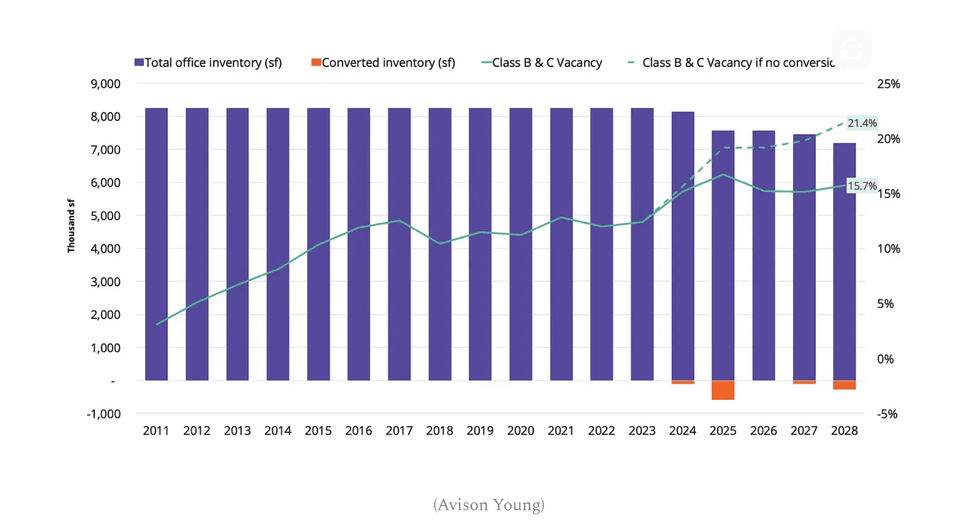 (Avison Young)
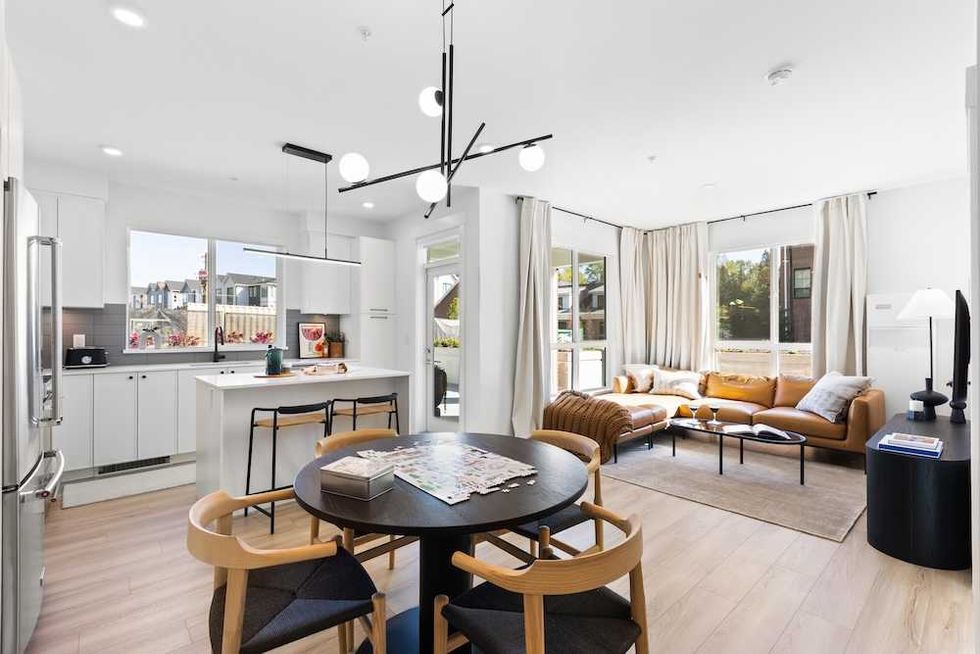 The Mason Suite Interior (Infinity Properties)
 The Mason Suite Interior (Infinity Properties)
 Rail District aerial (Infinity Properties)
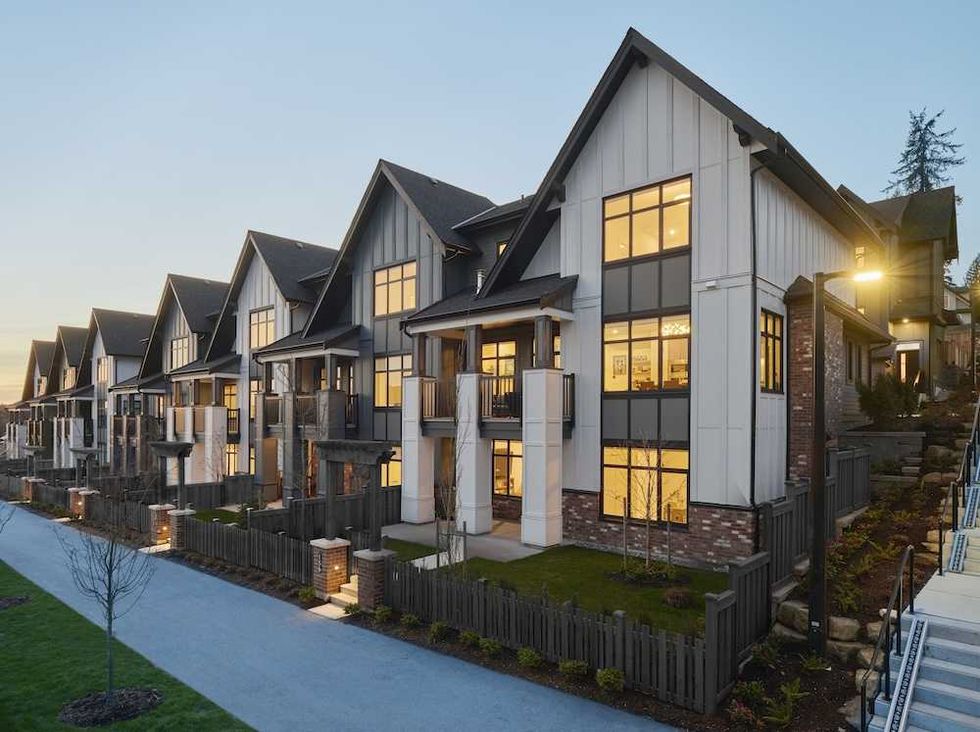 Versant (Infinity Properties)


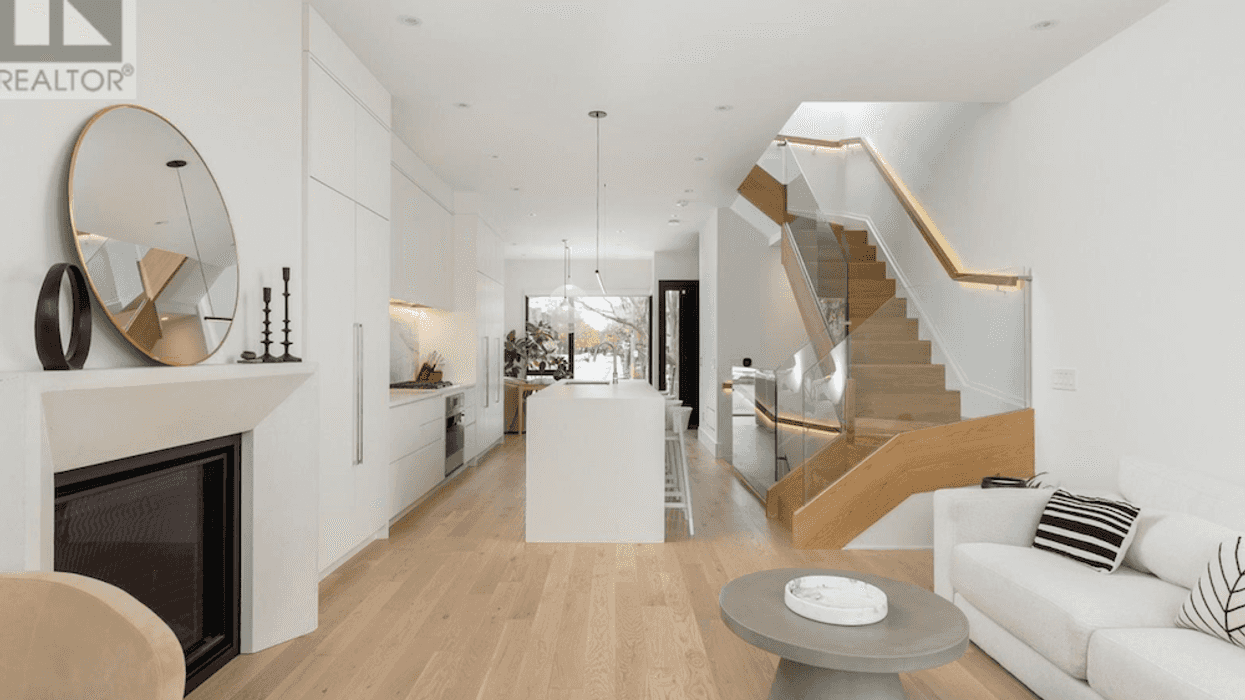





 Narrow Fourplex (City of Toronto)
 Wide Sixplex - Side View (City of Toronto)
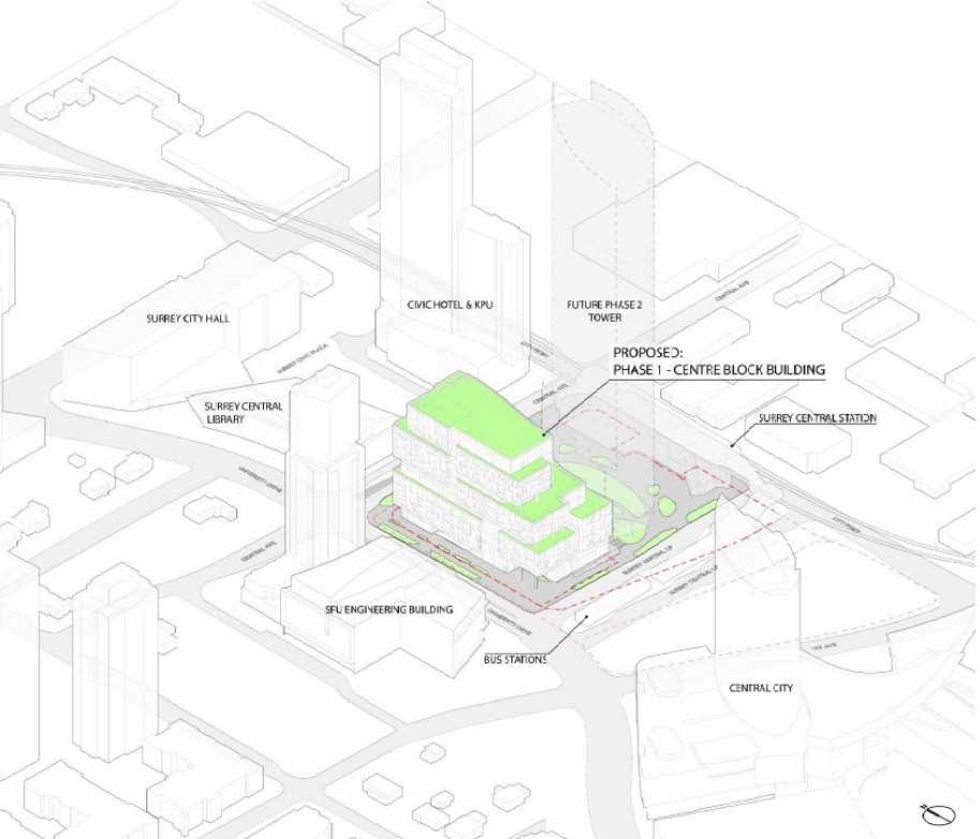 Centre Block and its surrounding context. (Stantec-Revery, SCDC)
 The 12-storey Phase One of Centre Block. (Stantec-Revery, SCDC)
 The 12-storey Phase One of Centre Block. (Stantec-Revery, SCDC)
 Mondria One, set for 1607 King Street East in Clarington, Ontario. (ICON Architects Inc., Monde Development Group)