Real estate can squeeze a recovery story out of almost any positive decimal.
CREA went with “Canadian Home Sales Climb Again in July.” Fair enough. Seasonally adjusted sales edged 0.5% higher, the fourth consecutive monthly gain. After the year this market has had, four green months were always going to get the full press-release treatment.
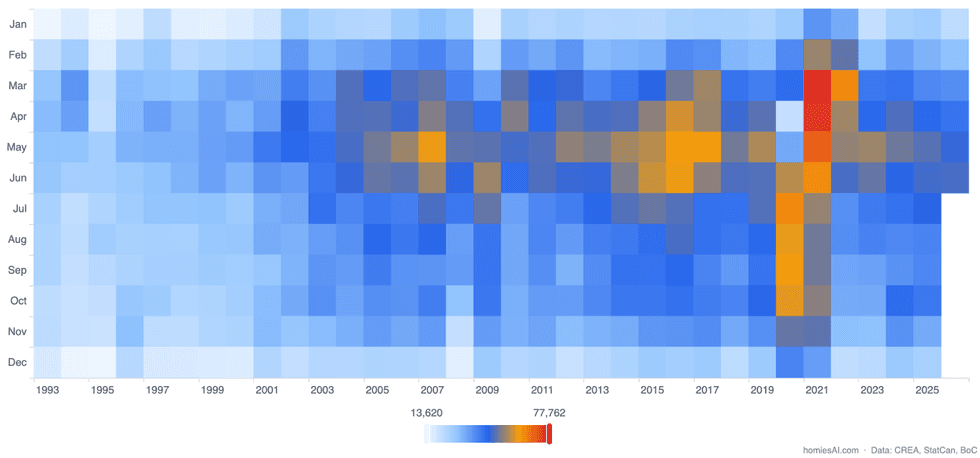
A run of four straight monthly gains heading into the middle of summer is unusual. Sales tend to soften in July and August, then get a second wind in the fall. Momentum deserves credit. Volume still pays the bills.
Canadian residential sales seasonality, through June
 Source: CREA Stats XML via HomiesAI.com AI Harness for Realtors
Zoom out and the picture is less flattering. Actual residential sales were 5.3% below last July. Year-to-date transactions were down 5.1%. The market has stopped sliding so quickly. Buyers are still scarce.
The number worth dwelling on is the 1.6% drop in new listings. It was the third monthly decline in a row. Actual listings were 6.9% below last July, with the year-to-date total down 4.6%.
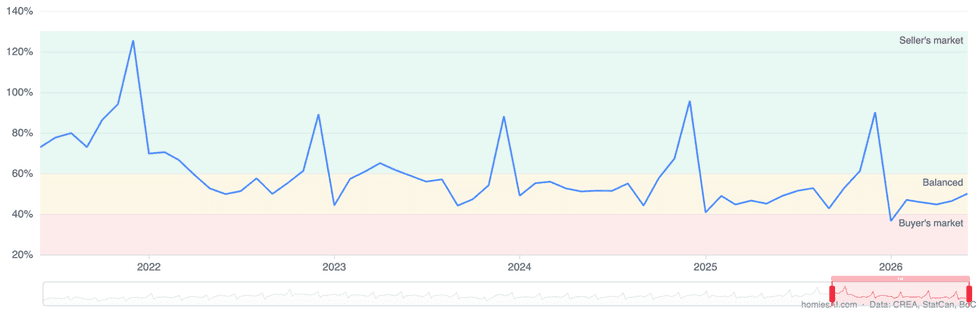
That retreat did plenty of work. It pushed the sales-to-new-listings ratio to 51.3%, closer to the long-run average of 54.7%. Sales barely moved while listings fell. The denominator did the heavy lifting.
Sellers left the field
CREA’s balanced-market call is defensible. Active inventory stood at 205,388 homes, up just 0.6% from last year and 1.5% above the long-run seasonal average. Months of inventory fell to 4.7, slightly below the long-run norm of five.
Falling prices tend to pull a few buyers forward and push a few sellers back. Eventually the two sides find each other. Right now, sellers seem to be doing more of the travelling.
When homeowners dislike the offers, some cancel, terminate or wait. Inventory disappears while purchasing power barely changes. The market tightens on paper before it feels busy on the ground.
Canada-wide numbers flatten a lot of local mess. Ontario sat at 4.4 months of inventory. British Columbia was at 6.8. Alberta was at 3.5. These are different markets wearing one statistic.
The pullback showed up most clearly in the expensive markets that carry much of the country’s housing pipeline. In Greater Toronto, new listings were down 17.8% from last July while sales slipped just 0.9%. Greater Vancouver listings fell 14.3% as sales fell 9.6%. In the Fraser Valley, listings dropped 22.3% and sales 7.3%.
That is a thinner market. It can feel healthier when stale product disappears and negotiating power evens out. Builders get some relief from resale competition. Affordability is still stretched, and the pool of qualified buyers is still shallow. Some homeowners simply chose to wait rather than test a weak bid.
Quebec shows the other side of the tape. Provincial listings rose 9.2% year over year while sales fell 6.4%. In Montreal, listings rose 4.3% and sales fell 10%. More product, fewer buyers.
Put those stories together, and the national headline lands near balance. Nobody underwrites a project off that average.
Canadian sales-to-new-listings ratio, five-year view through June
A tenth of a point can only tell you so much
The National Composite MLS Home Price Index rose 0.1% from June, its first monthly increase since late 2024. On an unadjusted basis, the index was still 3.3% below last year.
That tiny uptick will tempt the industry to call a bottom. I get the impulse. A green print after almost two years of declines is better than a red one. One monthly tenth still makes for a flimsy pricing thesis.
Buyers follow the direction of prices almost as closely as mortgage rates. Most think in nominal dollars. Inflation-adjusted returns are a debate for another day. When the price line keeps falling, waiting feels free. As declines slow, bottom-fishers edge forward. A few flat months would reduce the fear of losing equity between a firm offer and key day. We are close enough for the industry to talk about it. The proof still needs a few more prints.
The Greater Toronto benchmark was down 4.6% year-over-year, and 16% over three years. Greater Vancouver was down 6.2% on the year; the Lower Mainland, 6.4%; and the Fraser Valley, 7.1%. Mississauga was down 5.6% over one year, and 18.6% over three.
Elsewhere, the files look different. Calgary was down 0.9% year-over-year, Edmonton was up 0.4%, and Montreal was up 2.4%. These belong in separate underwriting files; blending them into one national index makes 0.1% sound more decisive than it is.
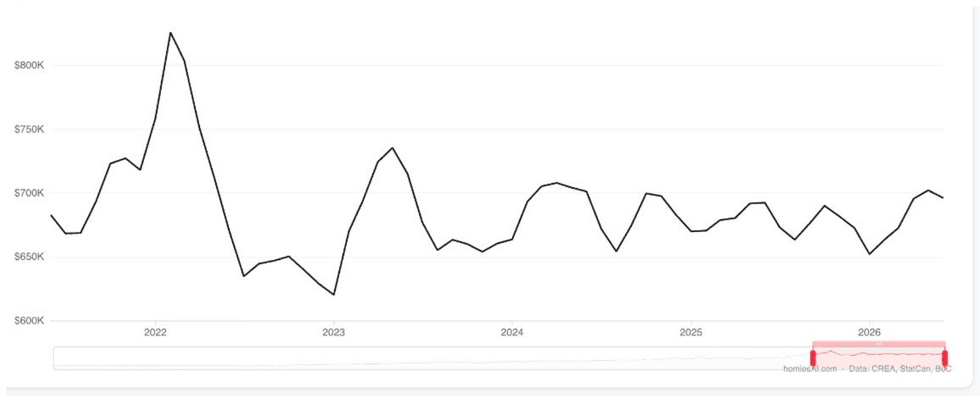
The average sale price, meanwhile, was $674,819, up 0.2% from last July. Average price follows the mix of deals that happened. A North York mid-rise and a Surrey townhouse clear on local comps, lender terms, and actual buyers. A 0.2% national increase offers very little cover for yesterday’s pro forma.
Canadian residential average price, five-year view through June
 Source: CREA Stats XML via HomiesAI.com AI Harness for Realtors
Absorption is still the tell
The monthly sales gain itself was narrow. Ontario rose 2.5% and the GTA rose 3.2%, while BC was effectively flat. Alberta fell 1.4% and Saskatchewan fell 4.9%.
Even in the GTA, which did most of the work in the monthly print, 5,995 homes traded, 0.9% fewer than last July. Greater Vancouver sales were down 9.6%. Edmonton was down 11%.
The national label still shapes how clients feel when they open Realtor.ca. The decision lives in a local segment. A condo buyer in Mississauga and a detached buyer in Montreal are reading very different markets.
For builders and lenders, one question outranks the market mood: how many units can clear at today’s price? The sales-to-new-listings ratio cannot answer it. A market can look orderly after competing resale signs disappear. Launch pacing, incentives, and lender appetite may sit exactly where they were.
Maybe boring is the bull case
Since 2020, housing has lurched from frenzy to freeze, with very little time spent in the uneventful middle.
The industry keeps a large jar labelled “pent-up demand” on the shelf for slow months. Some of it is real. Some was already spent. The 2020 to 2022 boom pulled three or four years of purchases forward, and those buyers do not get to buy a first home twice.
The people still waiting tend to want certainty as much as a deal. They are already watching stocks, bonds, oil, inflation, jobs, population growth, and a trade war. Housing could help by becoming the boring chart.
Six months of flat prices, ordinary sales, and predictable inventory would probably do more for confidence than another heroic headline.
What I’m watching this fall
First, listings in Toronto and Vancouver. If sellers return faster than buyers, the summer tightening was mostly a pause. If listings stay back, projects face less resale competition. Customer counts still have to be earned.
Second, the HPI. I want to see more than a rounding error, especially if sellers start testing the market again. Third, actual sales. They are still running below last year despite four consecutive monthly gains.
CREA’s balanced call may be right. For now, boring counts as progress.