Back-End Ratio
Learn about the back-end ratio in Canadian mortgage lending — what it measures, why it matters, and its impact on loan eligibility.

August 01, 2025
What is a Back-End Ratio?
The back-end ratio, or debt-to-income ratio, measures the percentage of a borrower’s gross monthly income spent on total monthly debt obligations, including housing expenses.
Why Back-End Ratio Matters in Real Estate
In Canadian mortgage lending, the back-end ratio is an essential measure of a borrower's overall financial health.
Details:
- Includes all debts: housing, car loans, credit cards, etc.
- Expressed as a percentage of gross income
- Lenders set maximum ratios for mortgage qualification
Understanding this ratio helps borrowers assess affordability and improve their financial profile before applying for loans.
Example of Back-End Ratio in Action
The applicant’s back-end ratio was 41%, exceeding the lender’s qualifying threshold.
Key Takeaways
- Indicates total debt burden relative to income
- Used in mortgage qualification decisions
- Includes housing and non-housing debts
- Lower ratios improve borrowing capacity
- Helps assess financial stability
Related Terms
- Gross Debt Service Ratio (GDS)
- Debt Service Ratios
- Mortgage Qualification
- Refinance
- Mortgage Pre-Approval






 Hale Founders Eric Abugov and Robin Kerbel
 This year's Board & Barrel: Charcuterie Experience will take place on July 25
 The Board & Barrel: Charcuterie Experience
 This year's Smash & Sear: Best in Burger Competition will be held on August 9
 The Smash & Sear: Best in Burger Competition
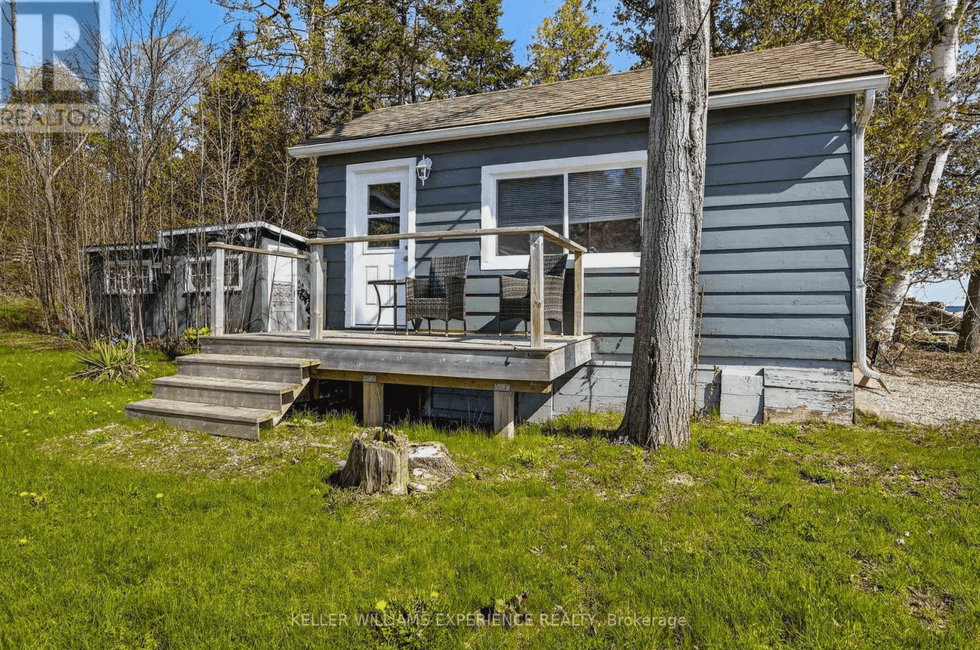
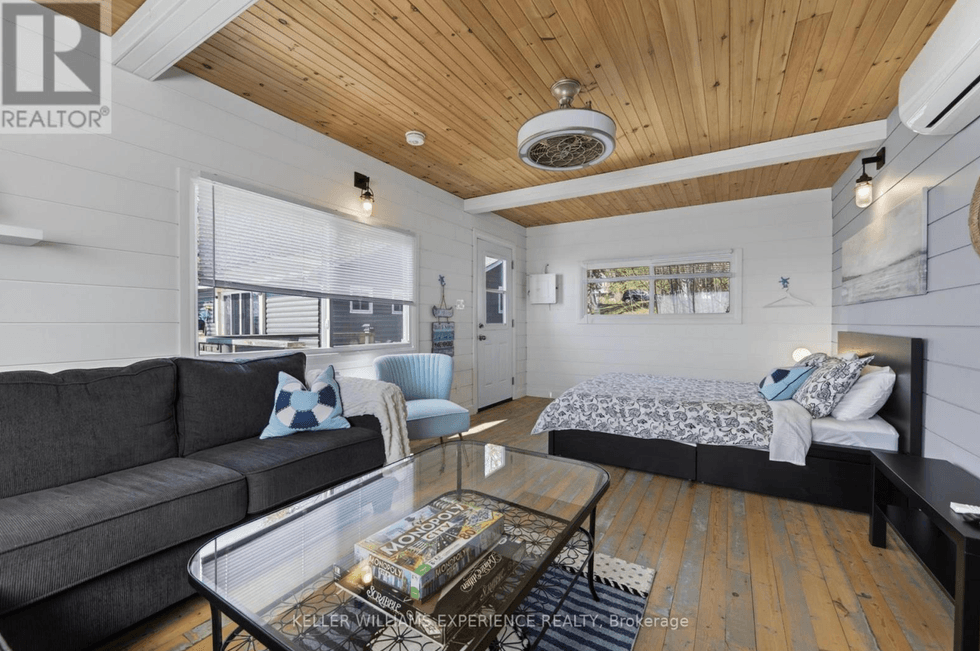
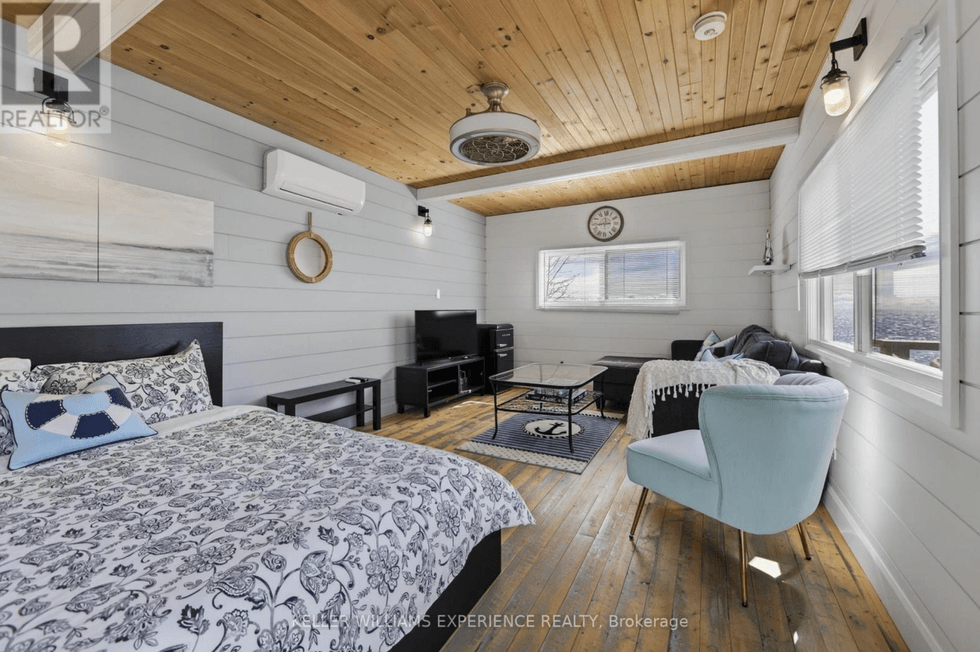
 Hale's new Cabin store opens this summer
 The Barn venue is slated for completion in spring 2027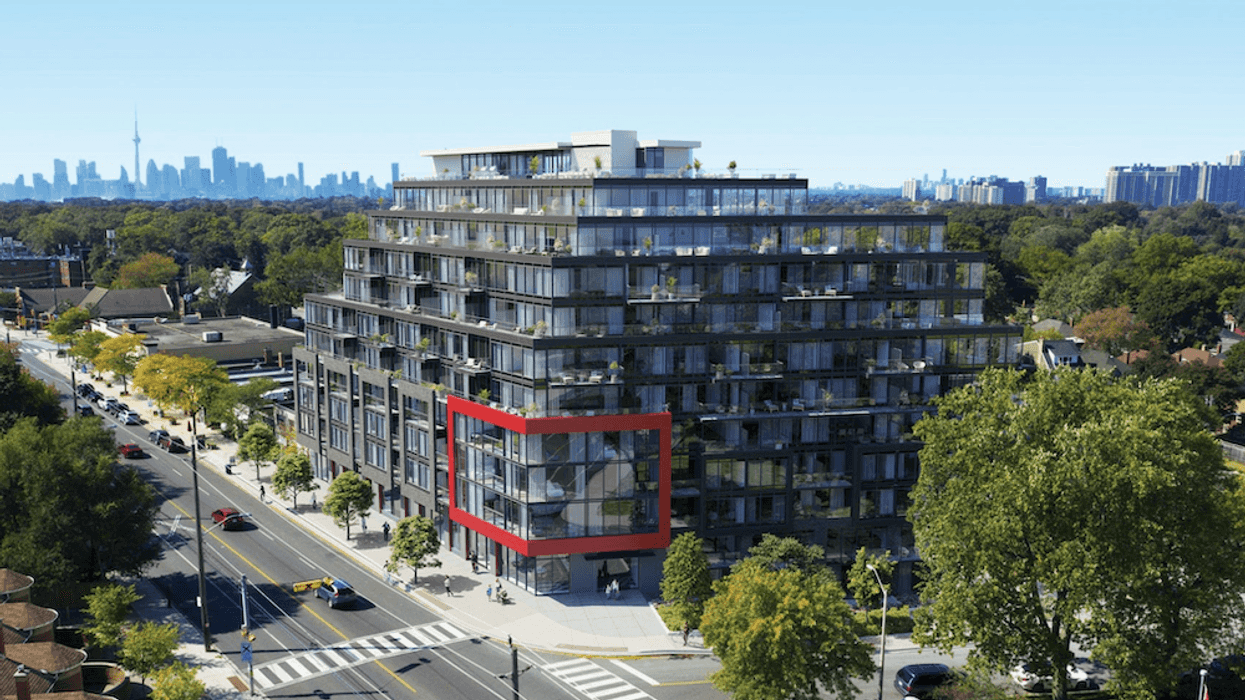




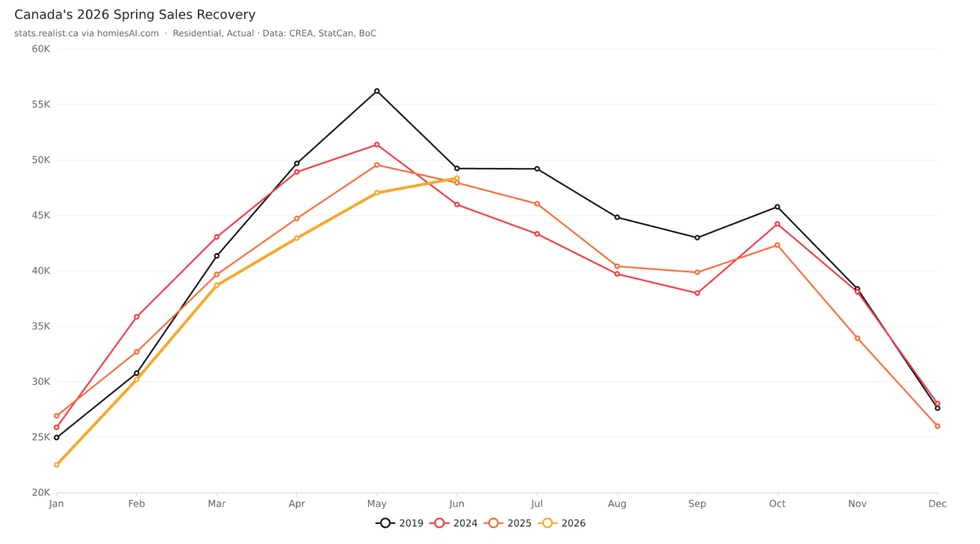 Canada residential unit sales by month, actual, 2019 and 2024-2026. Data through June 2026. Source:
 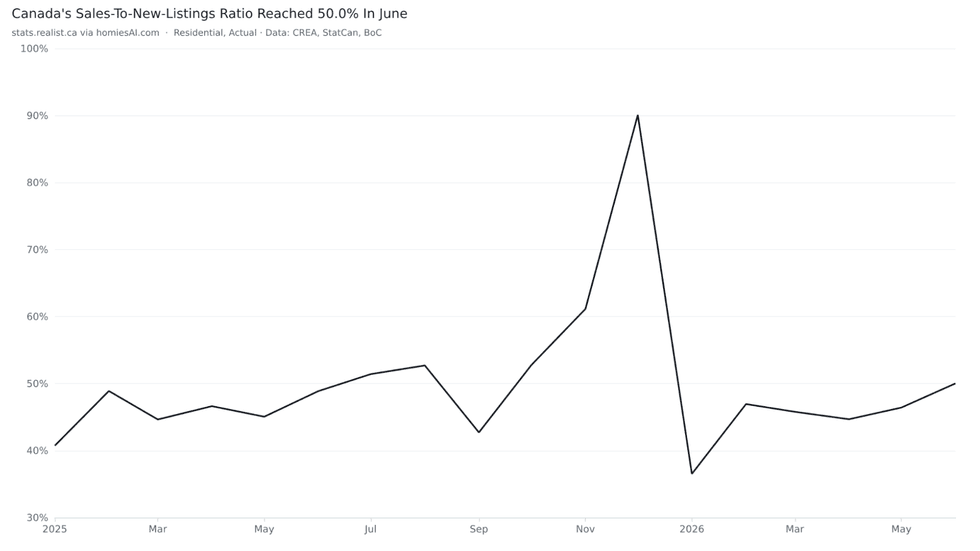 Canada residential sales-to-new-listings ratio, actual, January 2025 to June 2026. Source:
 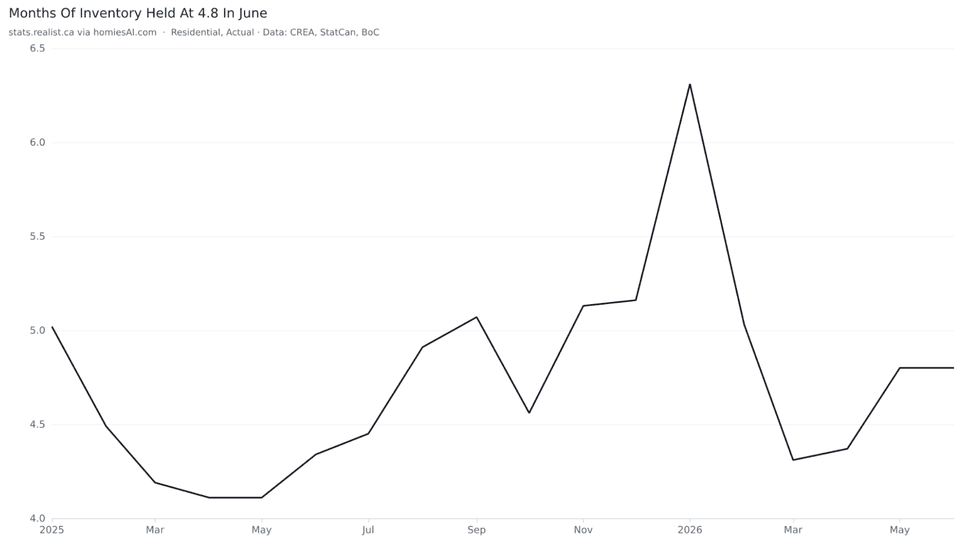 Canada residential months of inventory, actual, January 2025 to June 2026. Source: Source: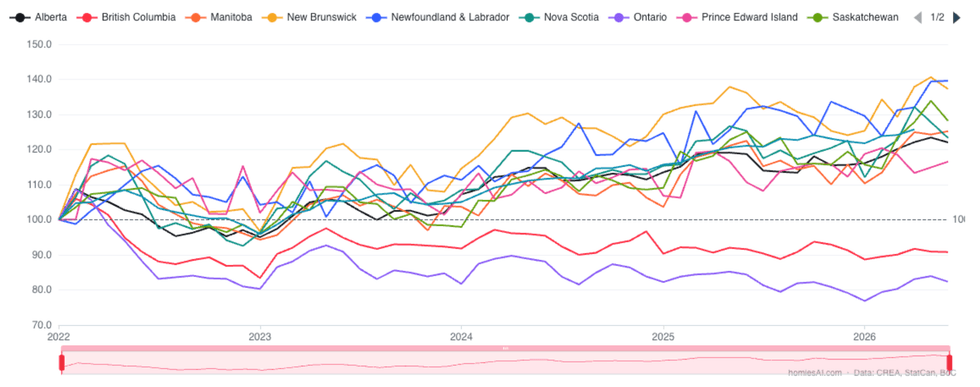
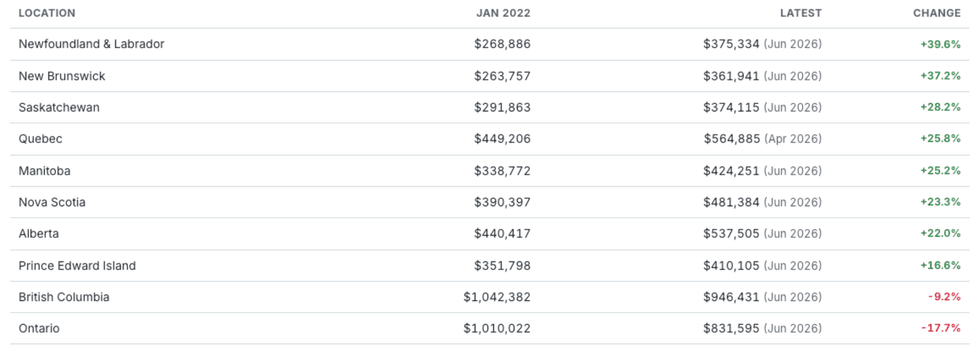 Year-over-year change in residential average sale price for Canada, Ontario, British Columbia and Alberta, January 2022 to June 2026. Average price is shown here as a regional mix measure, not a substitute for HPI or local comparable sales. Source:
 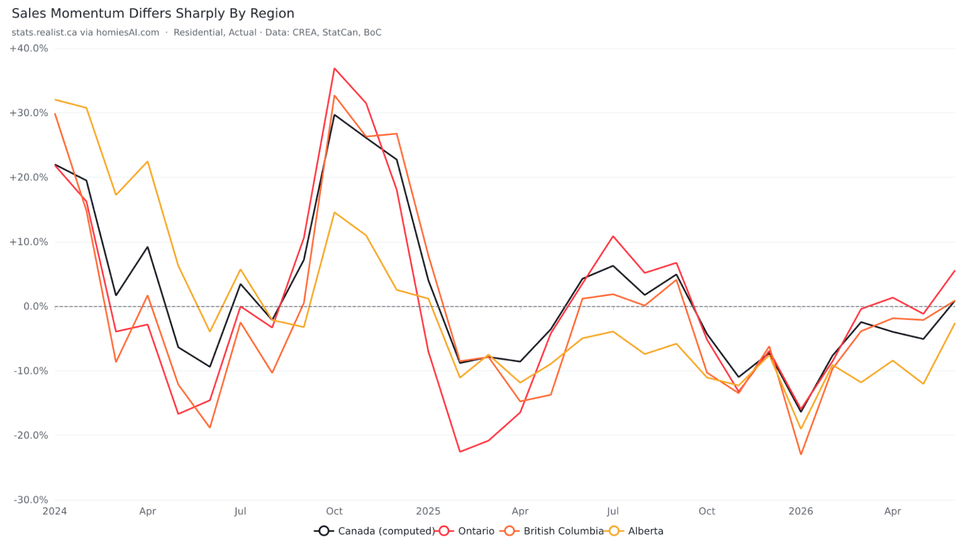 Year-over-year change in residential unit sales for Canada, Ontario, British Columbia and Alberta, January 2024 to June 2026. Source:

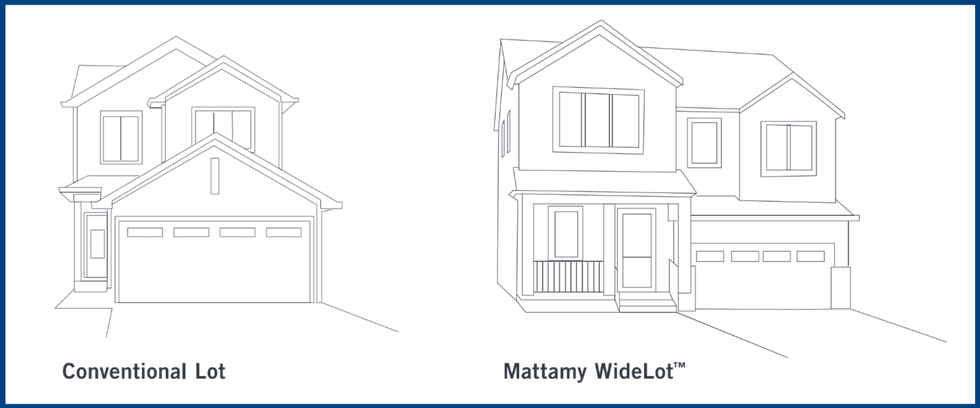 Mattamy WideLot™ design
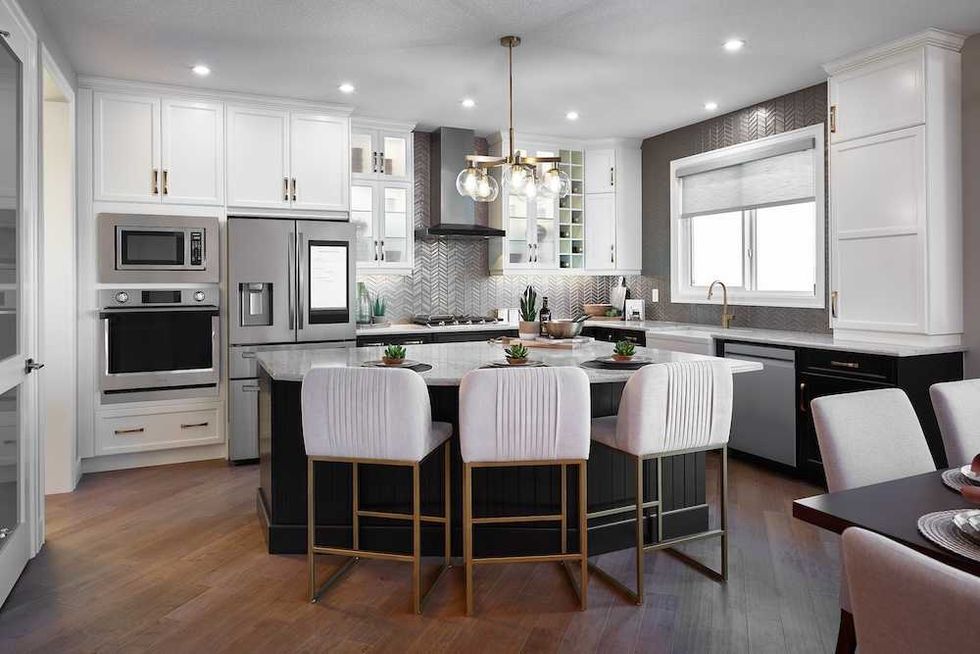 'The Cline' at Cityscape
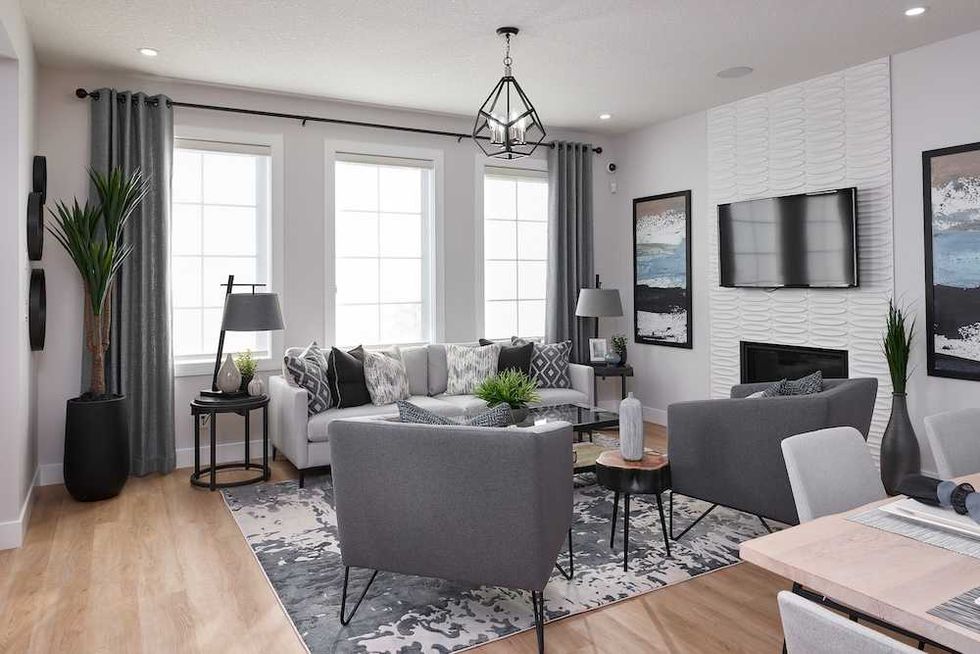 'The Monarch' at Yorkville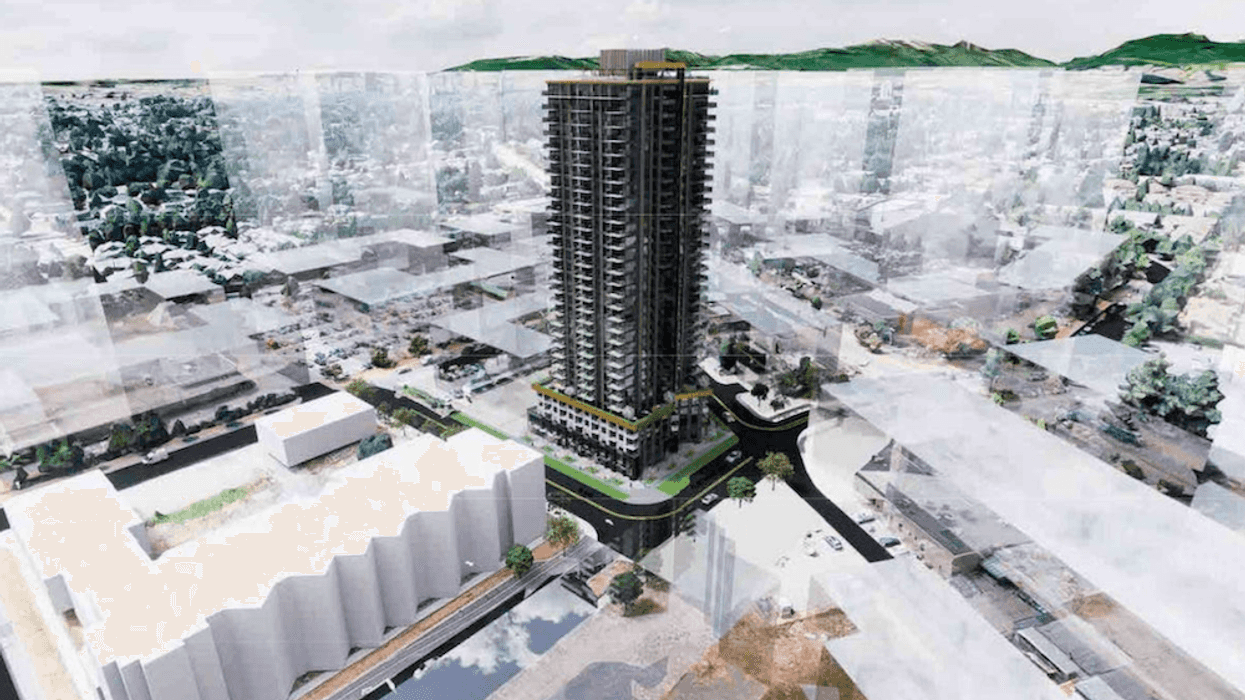
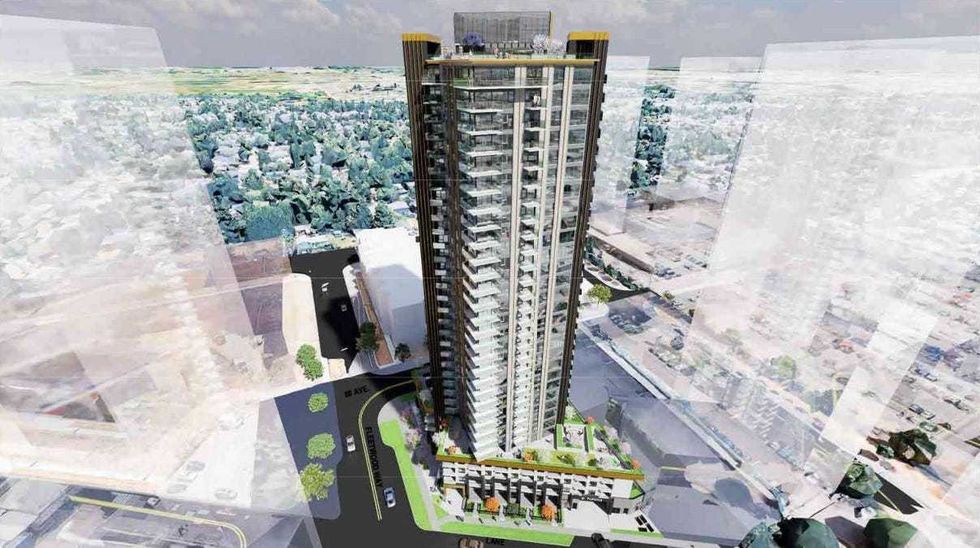
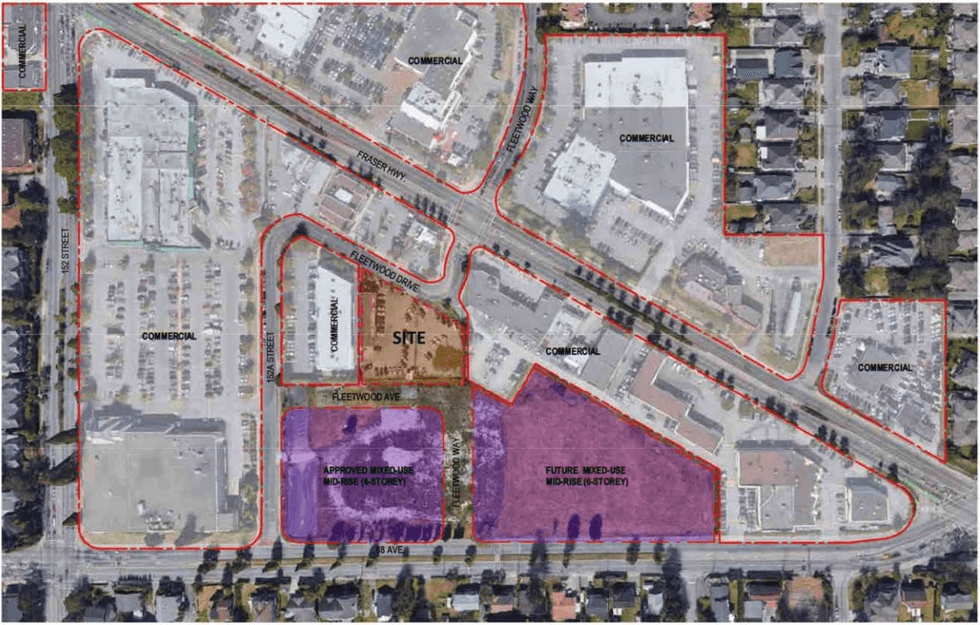 15284-15296 Fleetwood Drive in Surrey. (Flat Architecture, 1098261 BC Ltd.)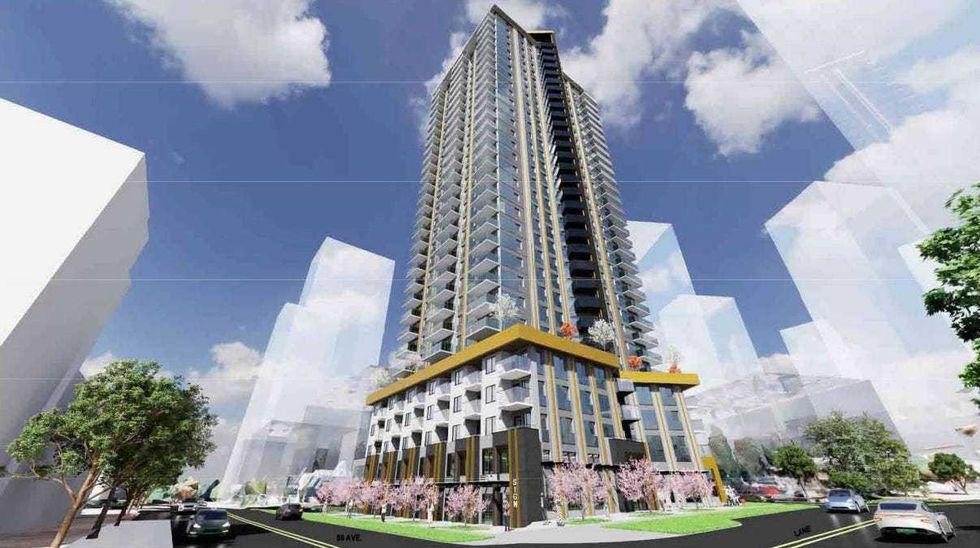
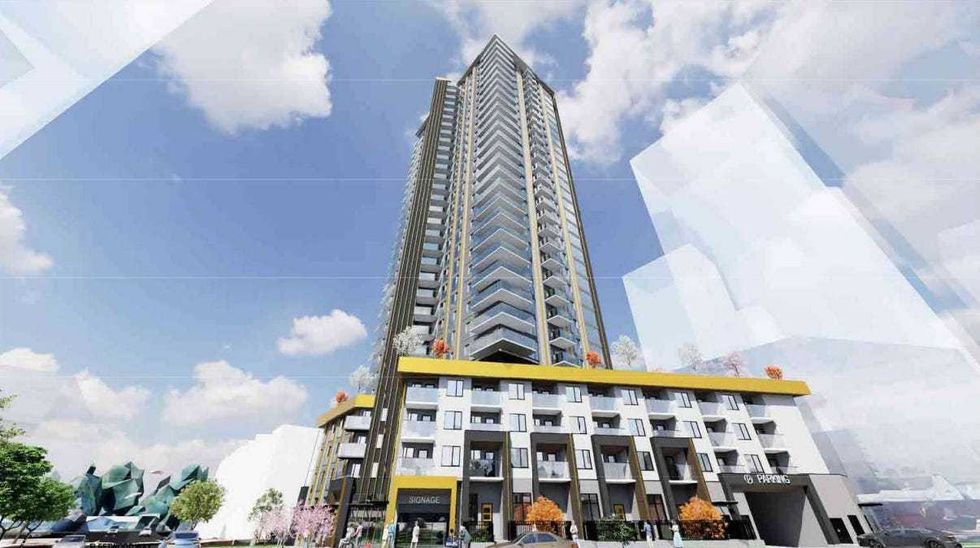 Renderings of the tower proposed for 15284-15296 Fleetwood Drive in Surrey. (Flat Architecture, 1098261 BC Ltd.)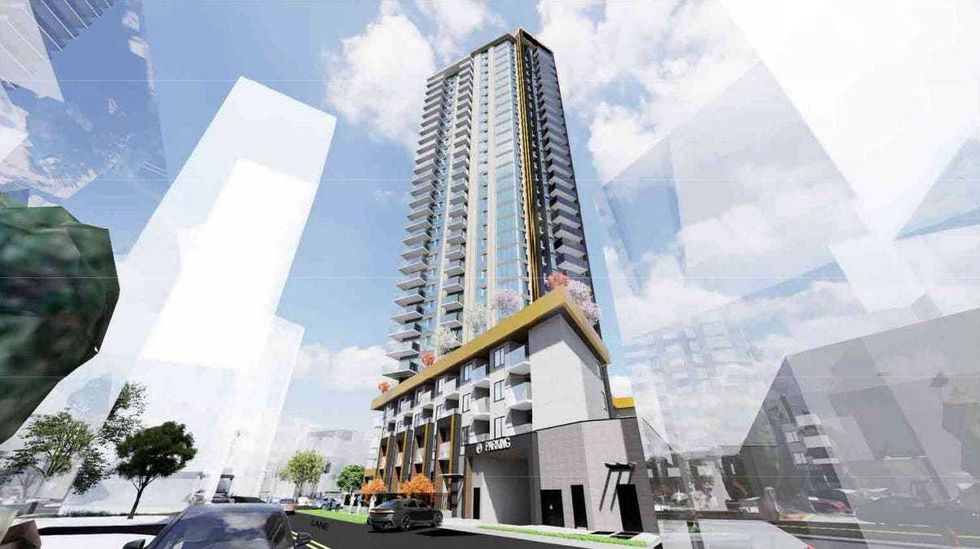




 Goldberg Group