Absorption Rate
Explore absorption rate in Canadian real estate — what it measures, how it's calculated, and why it matters to market analysis.

July 11, 2025
What is Absorption Rate?
Absorption rate is a metric that measures the rate at which available properties are sold or leased in a specific market over a given period.
Why Absorption Rate Matters in Real Estate
In Canadian real estate, absorption rate indicates market health, demand, and pricing trends, and is used by developers, investors, and agents.
Calculation:
- (Number of properties sold ÷ total available properties) × 100
- Expressed as a monthly or annual rate
High absorption rates suggest strong demand and a seller’s market, while low rates may indicate oversupply.
Example of Absorption Rate in Action
The city’s absorption rate for new condos rose sharply, reflecting strong demand and declining inventory.
Key Takeaways
- Measures how quickly properties sell
- Indicates market demand and health
- Guides pricing and development decisions
- High rates reflect strong demand
- Low rates signal oversupply
Related Terms
- Market Trends
- Housing Inventory
- Sales-To-New-Listings Ratio (SNLR)
- Sellers' Market
- Buyers' Market
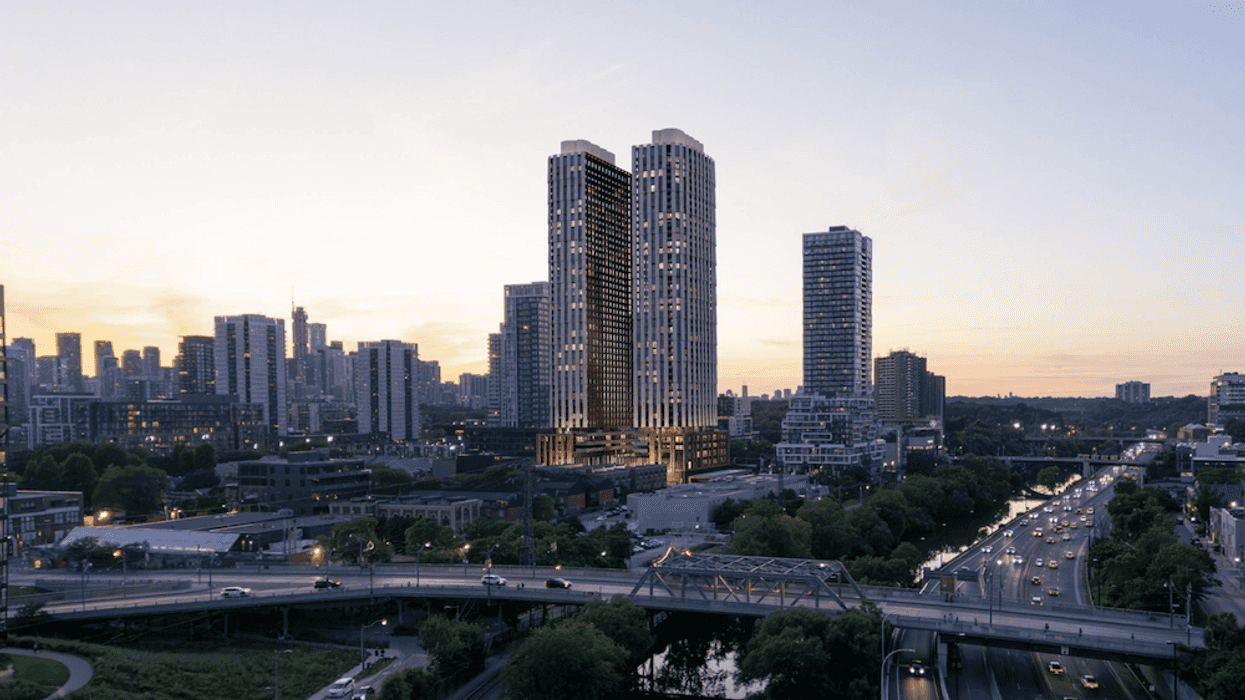
 Rendering of 86 and 100-108 Lombard St and 103 Richmond St E/WZMH Architects
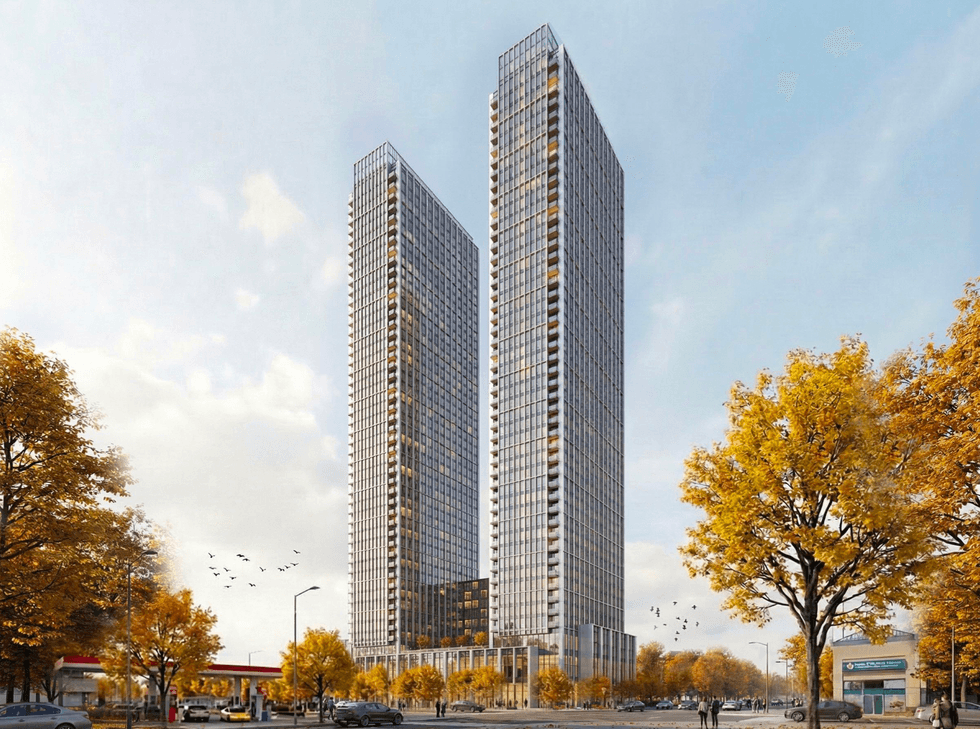 Rendering of 60 Overlea Blvd/Sweeny&Co Architects
 Rendering of 7 Labatt Ave and 77 River St/Giannone Petricone Associates
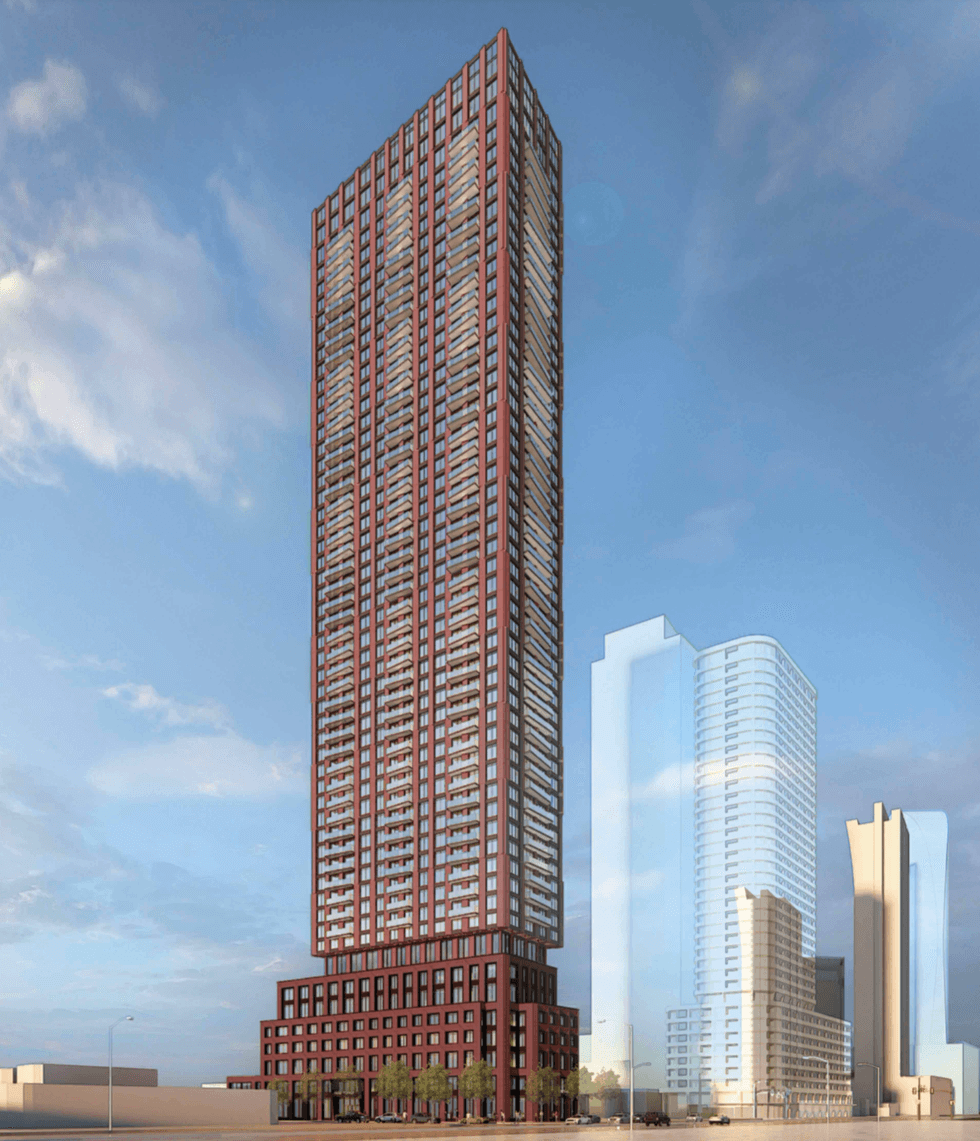 Rendering of 4632-4648 Yonge St and 16-18 Cameron Ave/Arcadis
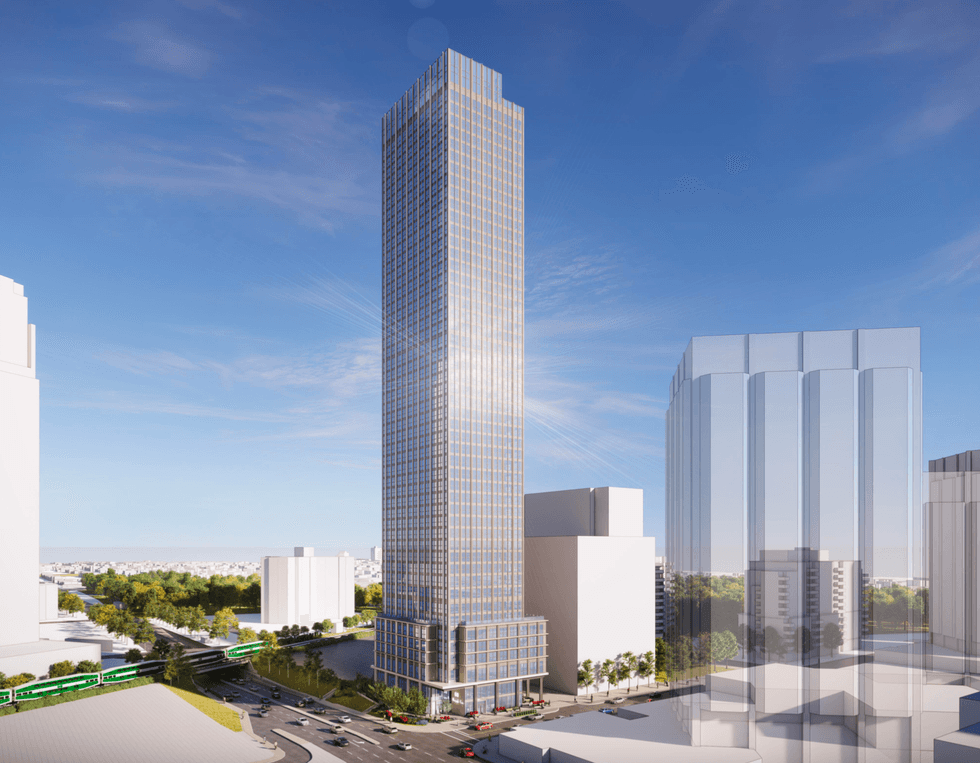 Rendering of 1234 Islington Ave/Sweeny&Co Architects
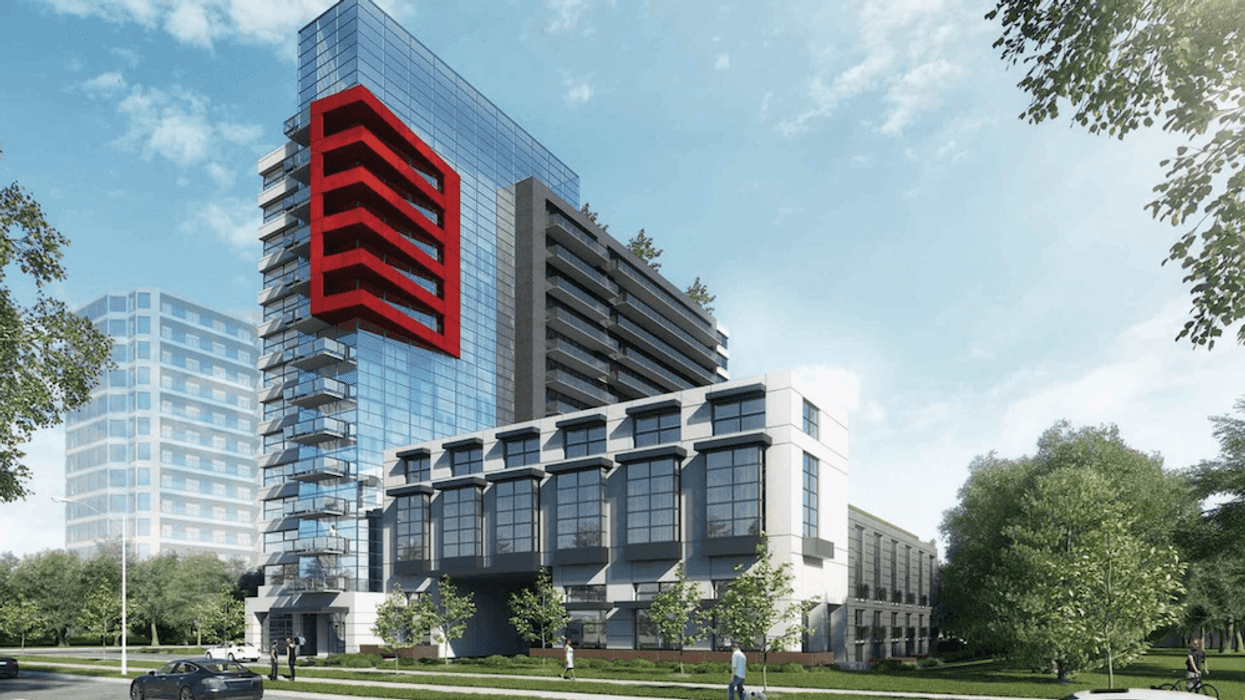



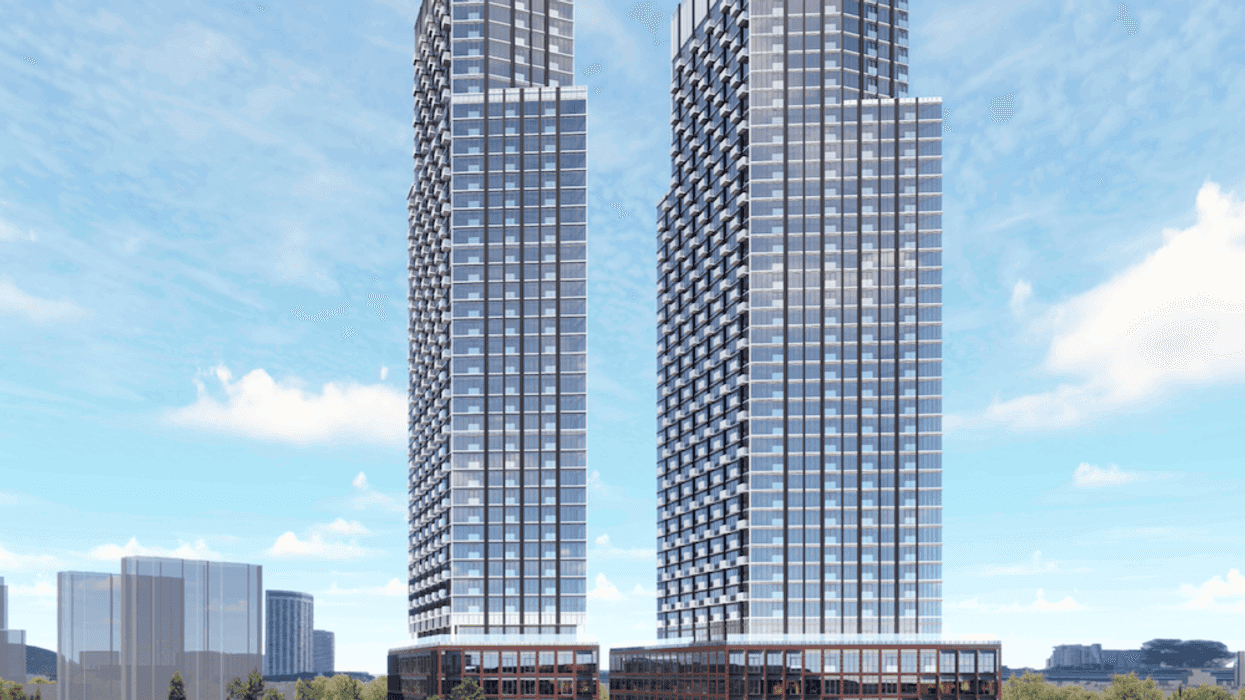
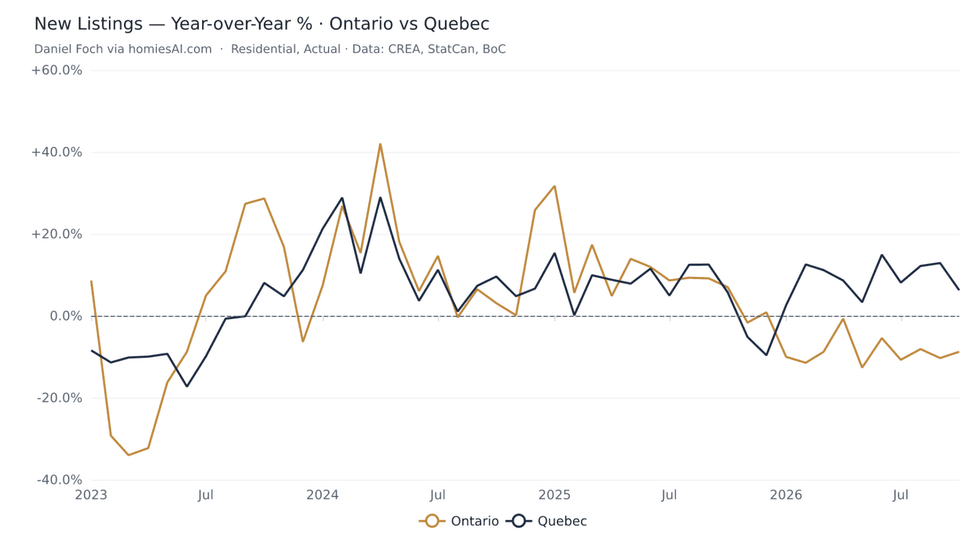 Chart: New listings, year-over-year %, Ontario vs Quebec. Daniel Foch via homiesai.com/stats. Data:
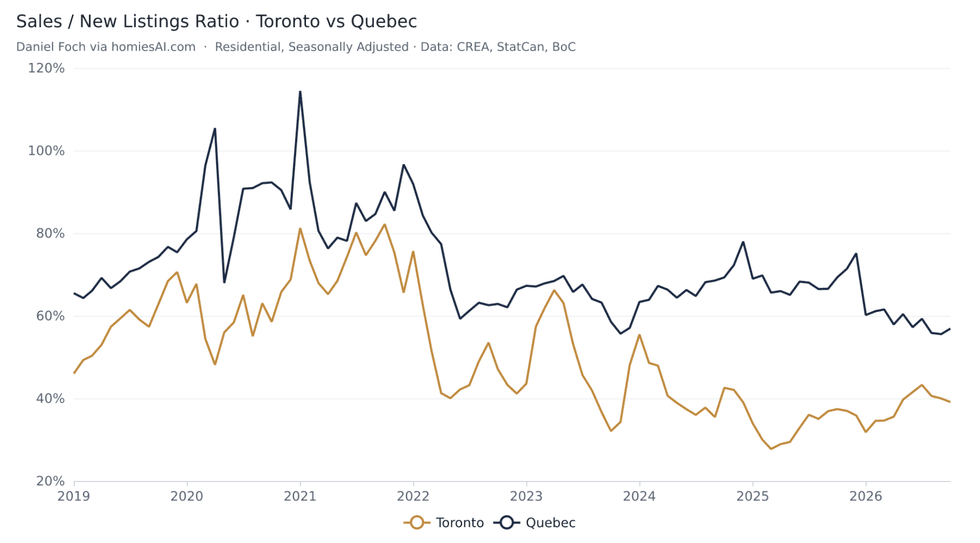 Chart: Sales-to-new-listings ratio, seasonally adjusted. Toronto vs Quebec. Daniel Foch via homiesai.com/stats. Data: CREA.
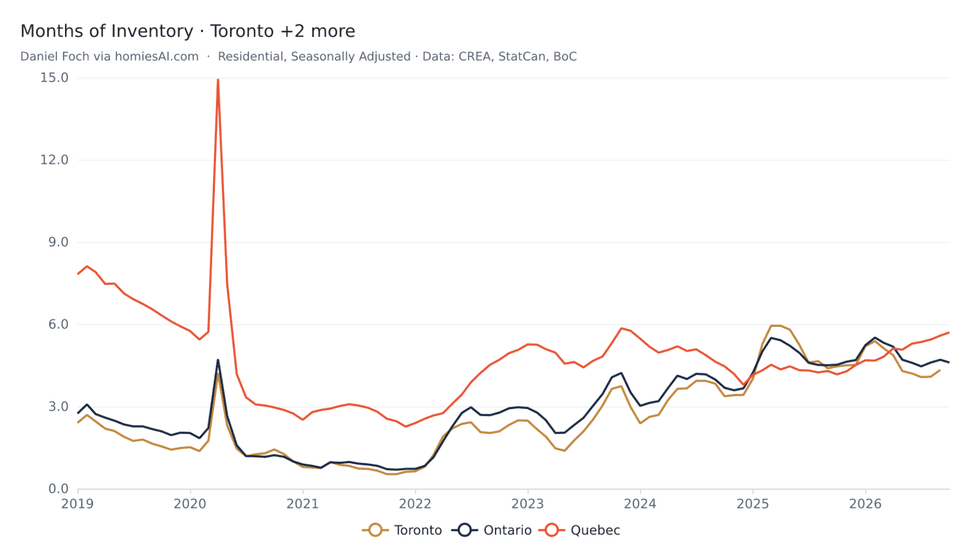 Chart: Months of inventory, seasonally adjusted. Daniel Foch via homiesai.com/stats. Data: CREA.
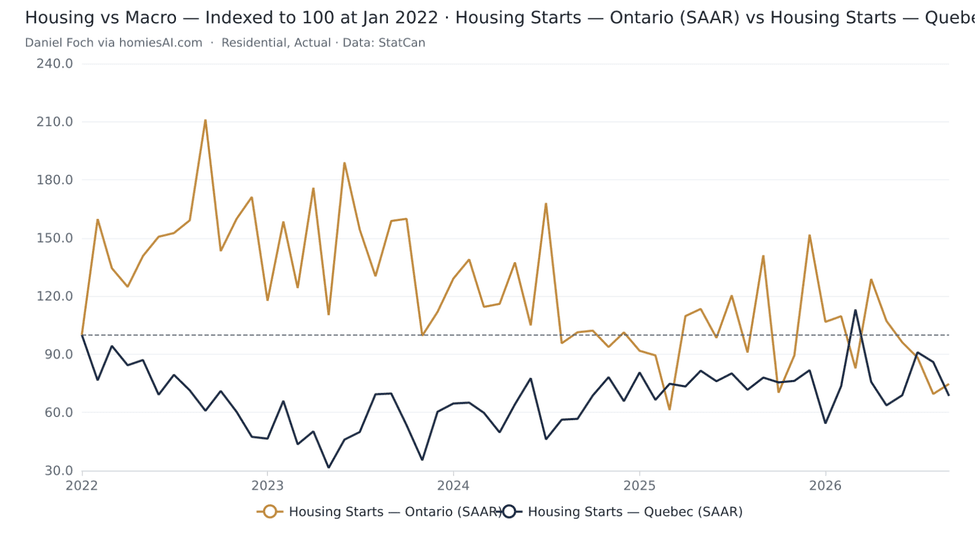 Chart: Housing starts, seasonally adjusted annual rate, Ontario vs Quebec, indexed to January 2022. Daniel Foch via homiesai.com/stats. Data: CMHC via Statistics Canada.
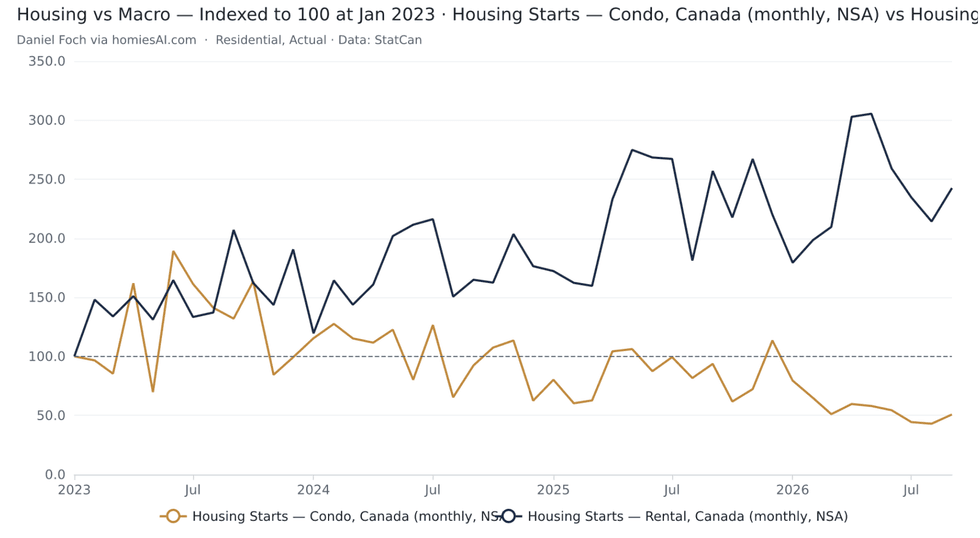 Chart: Condo vs rental housing starts, Canada, indexed to January 2023. Daniel Foch via homiesai.com/stats. Data: CMHC via Statistics Canada.
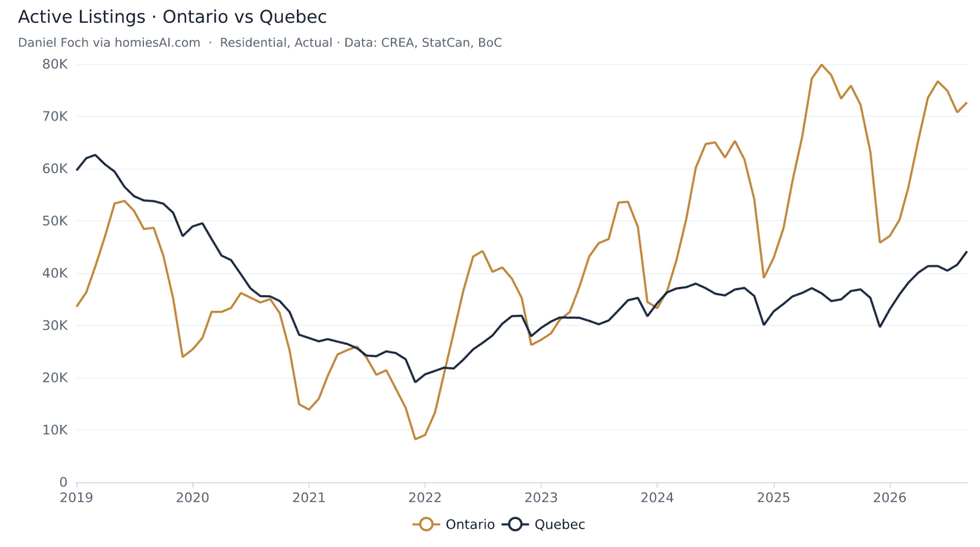 Chart: Active residential listings, Ontario vs Quebec. Daniel Foch via homiesai.com/stats. Data: CREA.
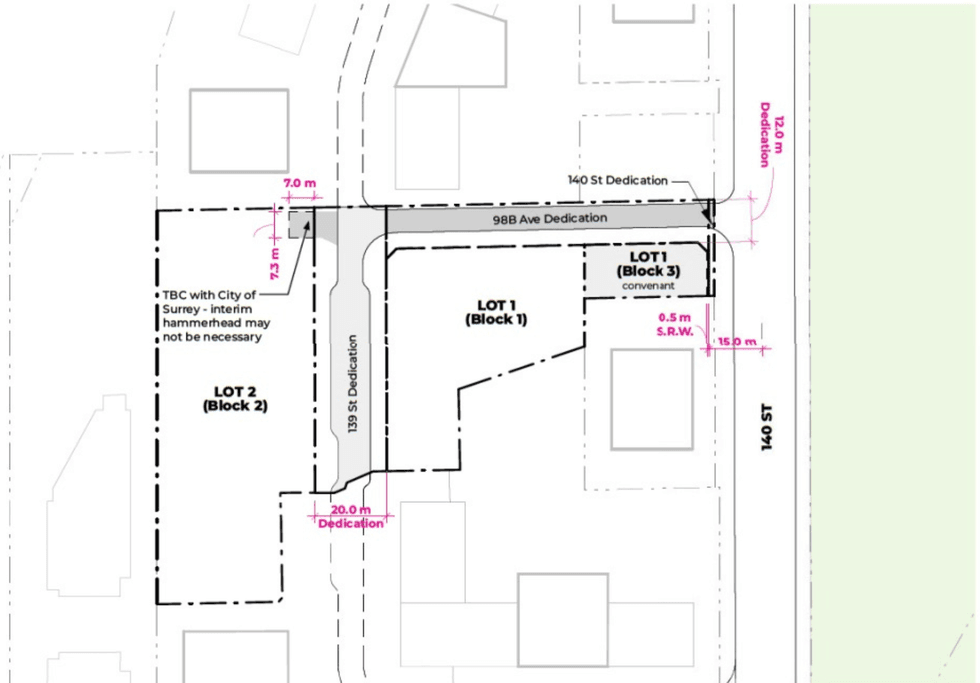 9883 140 Street and the proposed road dedications. (WW+P Architects, Entre Nous Femmes Housing Society)
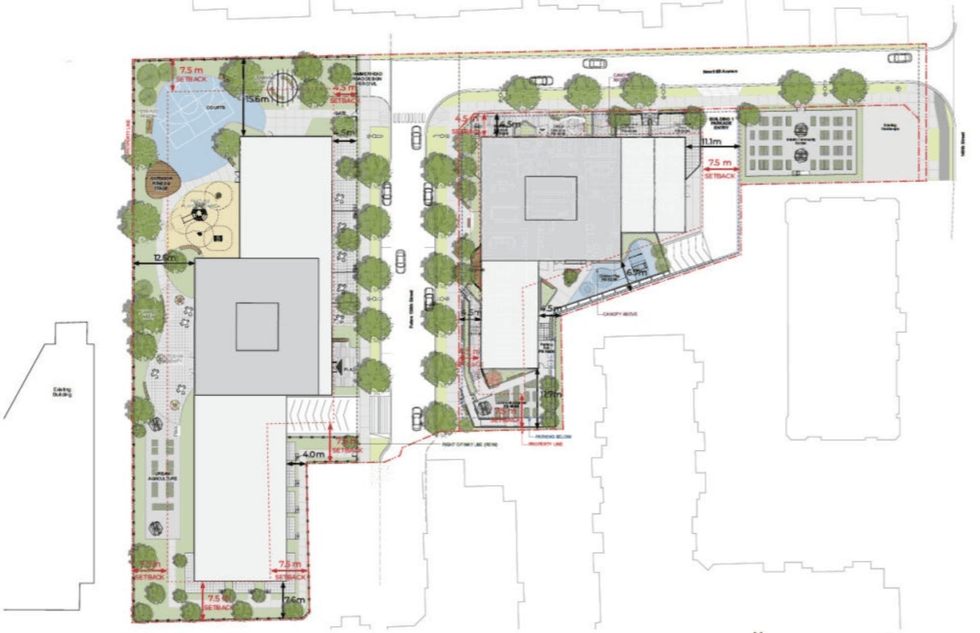 The
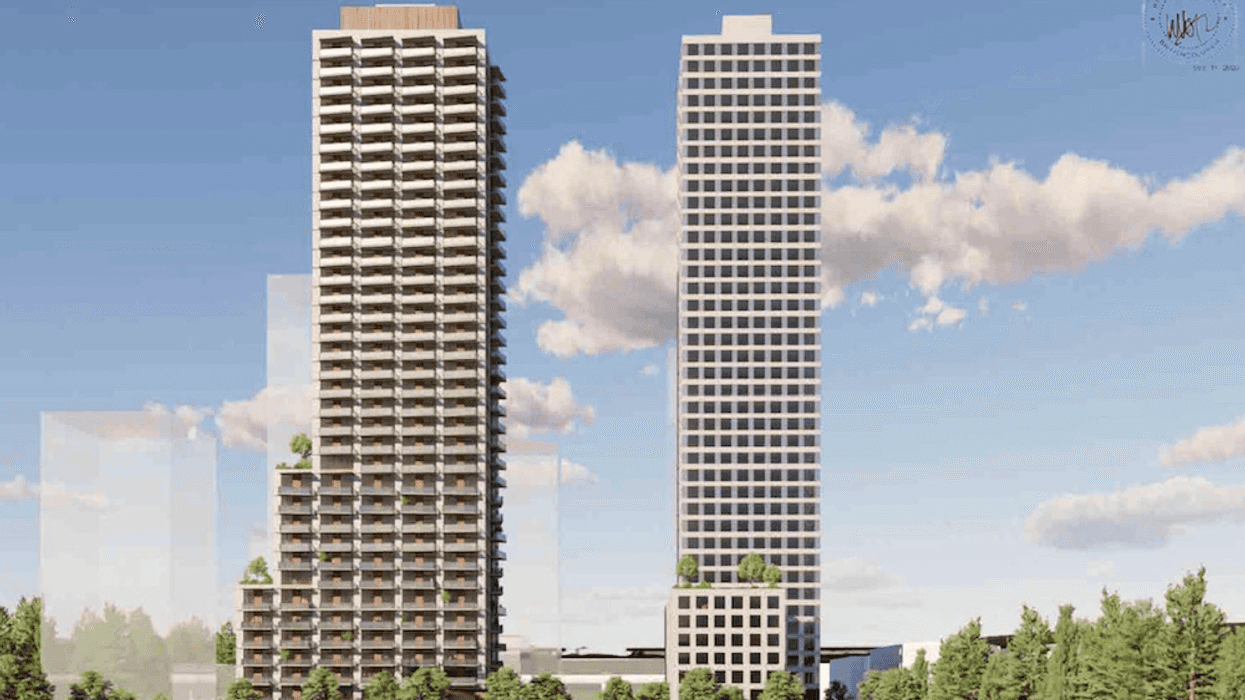
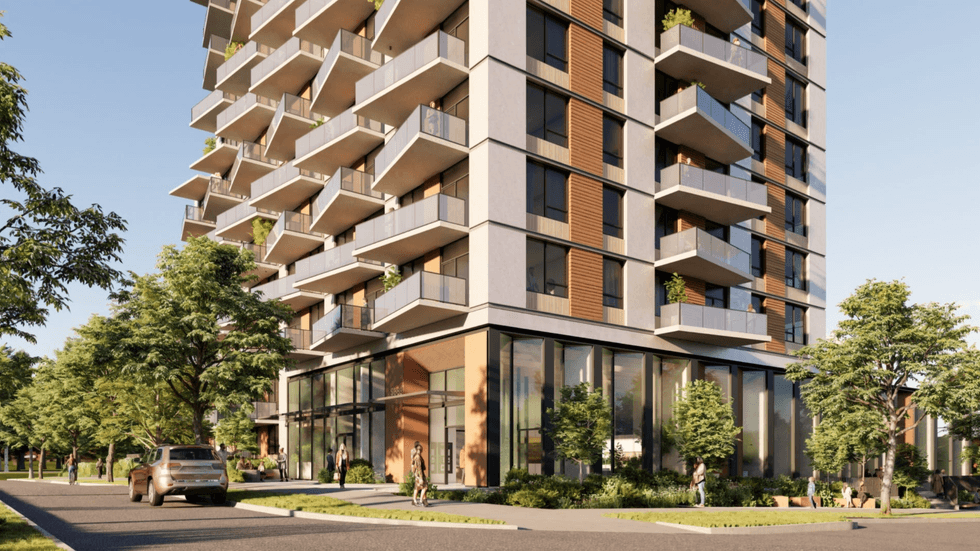 One of the towers proposed for 9883 140 Street. (Entres Nous Femmes Housing Society)

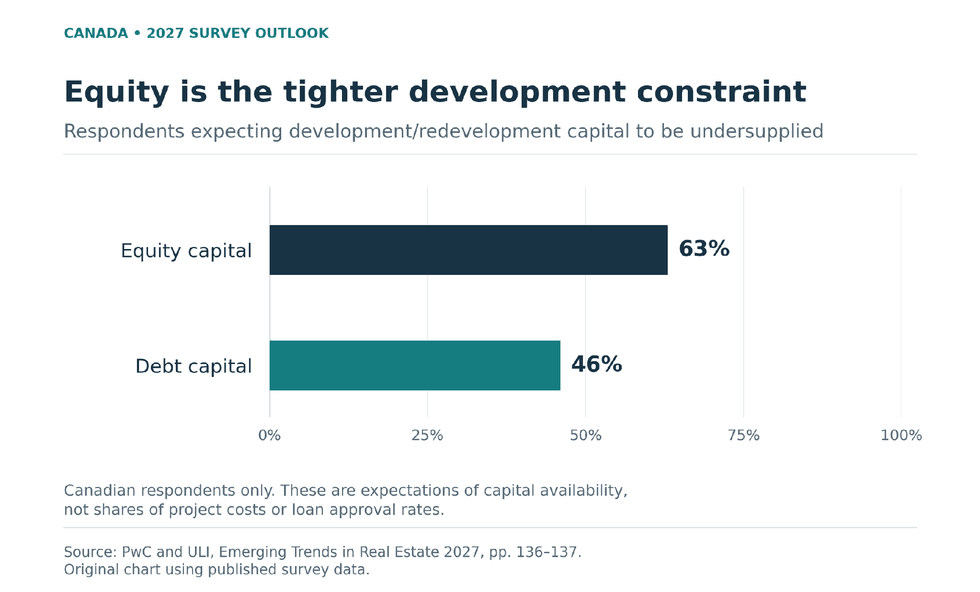 Canadian respondents were more likely to expect an undersupply of development/redevelopment equity capital (63%) than debt capital (46%) in 2027. These are survey expectations, not measured financing volumes. Source: PwC and ULI, Emerging Trends in Real Estate 2027, pp. 136–137. Original chart.
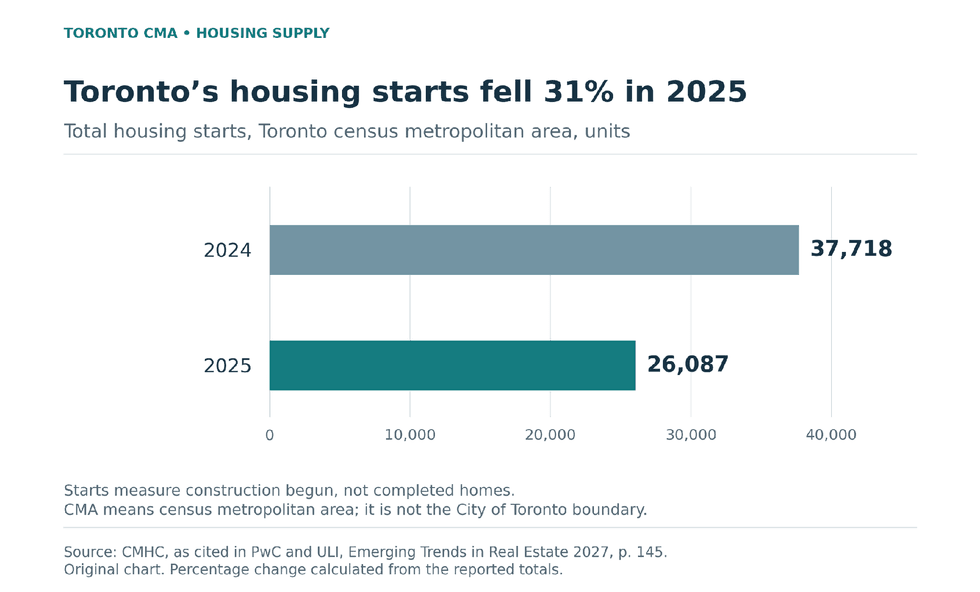 Toronto census metropolitan area housing starts fell from 37,718 units in 2024 to 26,087 in 2025, a 30.8% decline (rounded to 31%). Starts measure construction begun, not completed homes. Source: CMHC, as cited in PwC and ULI, Emerging Trends in Real Estate 2027, p. 145. Original chart.