Public-Private Partnership
Learn about public-private partnerships (P3s) in Canada — what they are, how they work, and why they’re used for infrastructure projects.

August 01, 2025
What is a Public-Private Partnership?
A public-private partnership (P3) is a collaborative arrangement between a government agency and a private-sector company to finance, build, and operate infrastructure projects or deliver services.
Why Public-Private Partnerships Matter in Real Estate
In Canadian real estate and infrastructure, P3s help governments leverage private capital and expertise to complete large-scale projects efficiently.
Key features:
- Shared risk and responsibility between public and private partners
- Long-term contracts outlining performance standards
- Used for transportation, hospitals, schools, and utilities
Understanding P3s helps developers and municipalities explore financing and delivery models for major infrastructure needs.
Example of a Public-Private Partnership in Action
The city entered a public-private partnership to build and operate a new light rail transit line.
Key Takeaways
- Combines public oversight and private investment
- Used for major infrastructure and facilities
- Shares risks and rewards between parties
- Requires detailed, long-term agreements
- Can accelerate project delivery and innovation

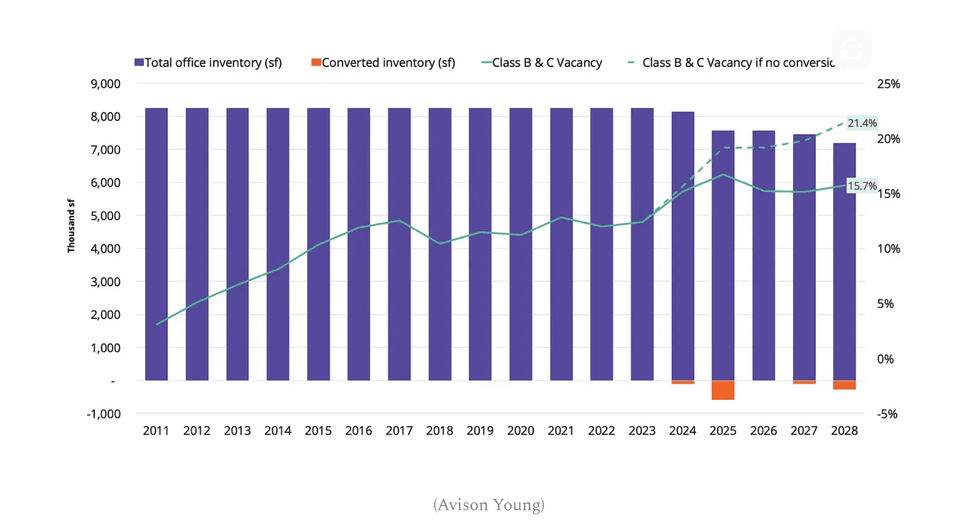 (Avison Young)
 The Mason Suite Interior (Infinity Properties)
 The Mason Suite Interior (Infinity Properties)
 Rail District aerial (Infinity Properties)
 Versant (Infinity Properties)








 Narrow Fourplex (City of Toronto)
 Wide Sixplex - Side View (City of Toronto)
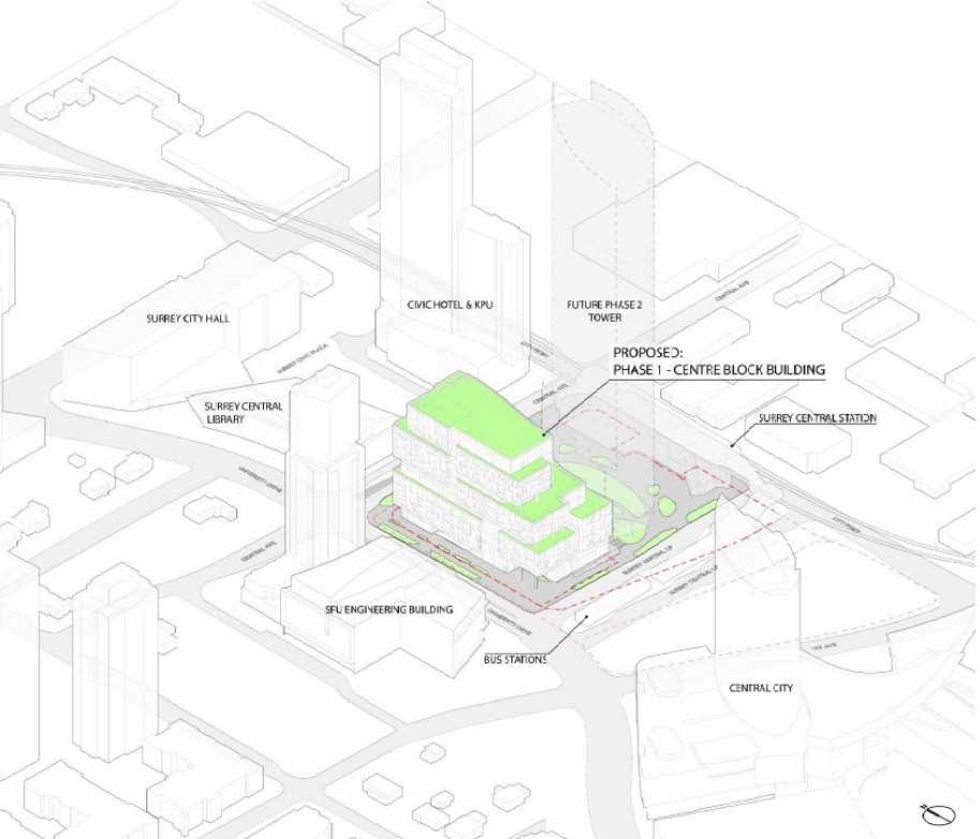 Centre Block and its surrounding context. (Stantec-Revery, SCDC)
 The 12-storey Phase One of Centre Block. (Stantec-Revery, SCDC)
 The 12-storey Phase One of Centre Block. (Stantec-Revery, SCDC)
 Mondria One, set for 1607 King Street East in Clarington, Ontario. (ICON Architects Inc., Monde Development Group)