Halo Effect
Learn what the halo effect is in Canadian real estate and how major developments can drive price increases and buyer demand in nearby areas.
May 30, 2025
What is the Halo Effect?
The halo effect in real estate refers to the positive influence that a popular or high-end development has on the surrounding property values and desirability of nearby areas.
Why Does the Halo Effect Matter in Real Estate?
In Canadian real estate, the halo effect can significantly impact residential and commercial property prices by increasing demand in adjacent neighbourhoods.
It often occurs due to:
- The opening of luxury retail, condos, or business districts
- New public transit lines or high-profile infrastructure
- Rejuvenation projects or cultural landmarks
The halo effect can attract investors and developers to overlooked areas, accelerating gentrification or revitalization.
Understanding the halo effect helps buyers and investors anticipate value growth and make informed location-based decisions.
Example of the Halo Effect in Action
After a tech campus opened downtown, surrounding properties appreciated due to the halo effect, even in previously undervalued neighbourhoods.
Key Takeaways
- Positive impact of major developments.
- Raises demand and prices in adjacent areas.
- Driven by retail, transit, or business anchors.
- Attracts investors and renovators.
- Useful for predicting value appreciation.
Related Terms
- Market Value
- Gentrification
- Transit-Oriented Development
- Investment Property
- Property Value
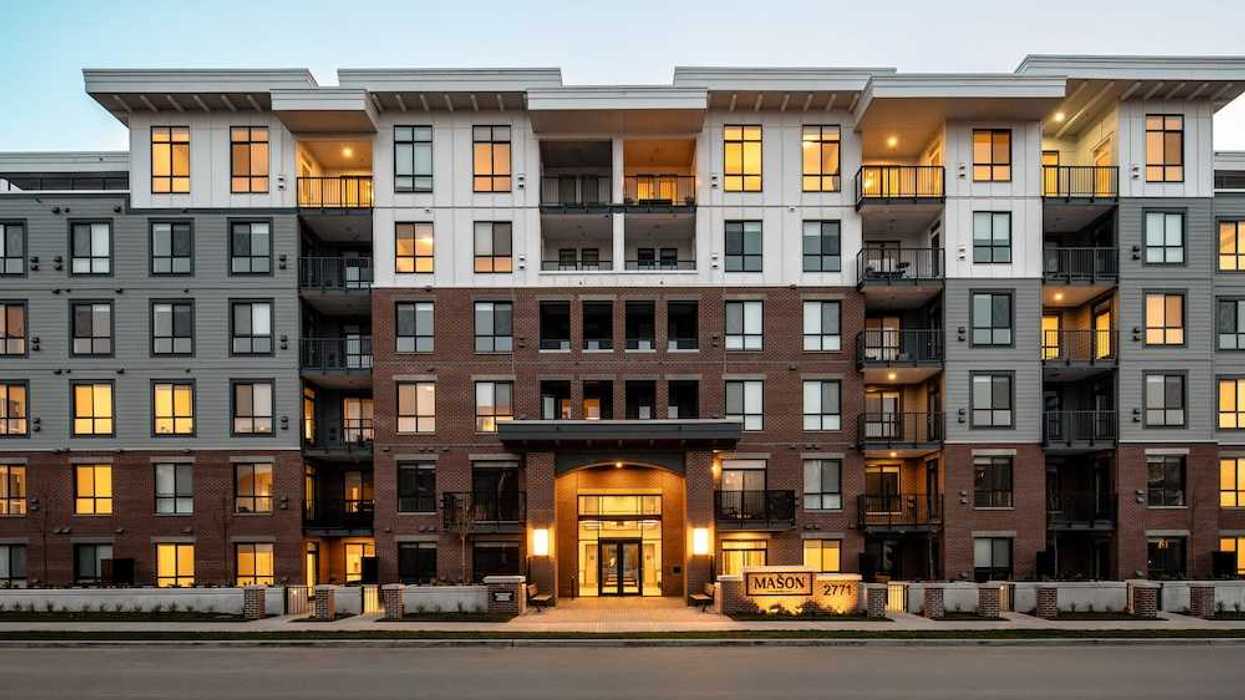
 The Mason Suite Interior (Infinity Properties)
 The Mason Suite Interior (Infinity Properties)
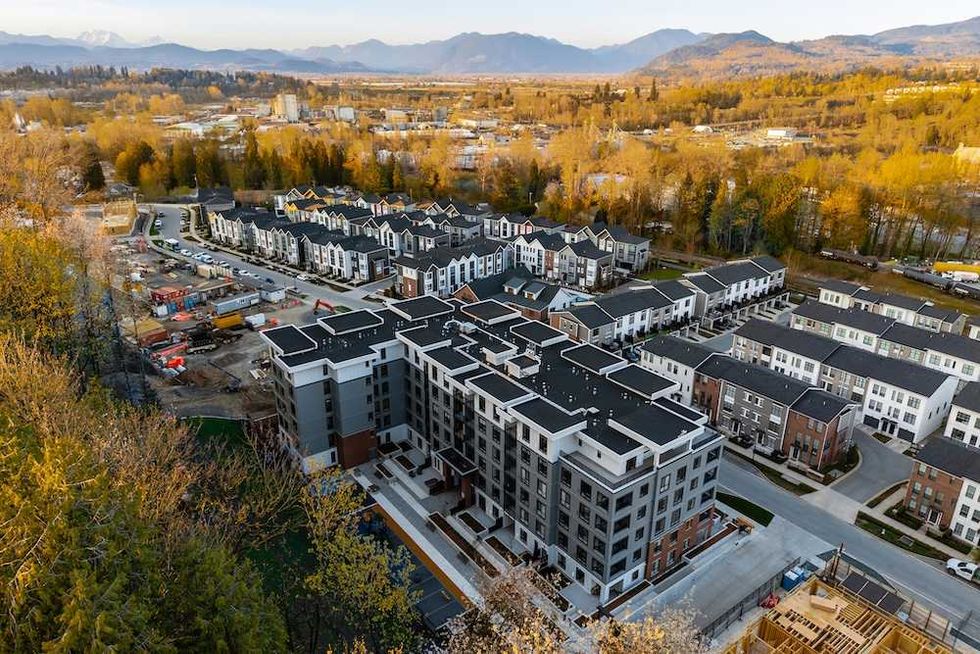 Rail District aerial (Infinity Properties)
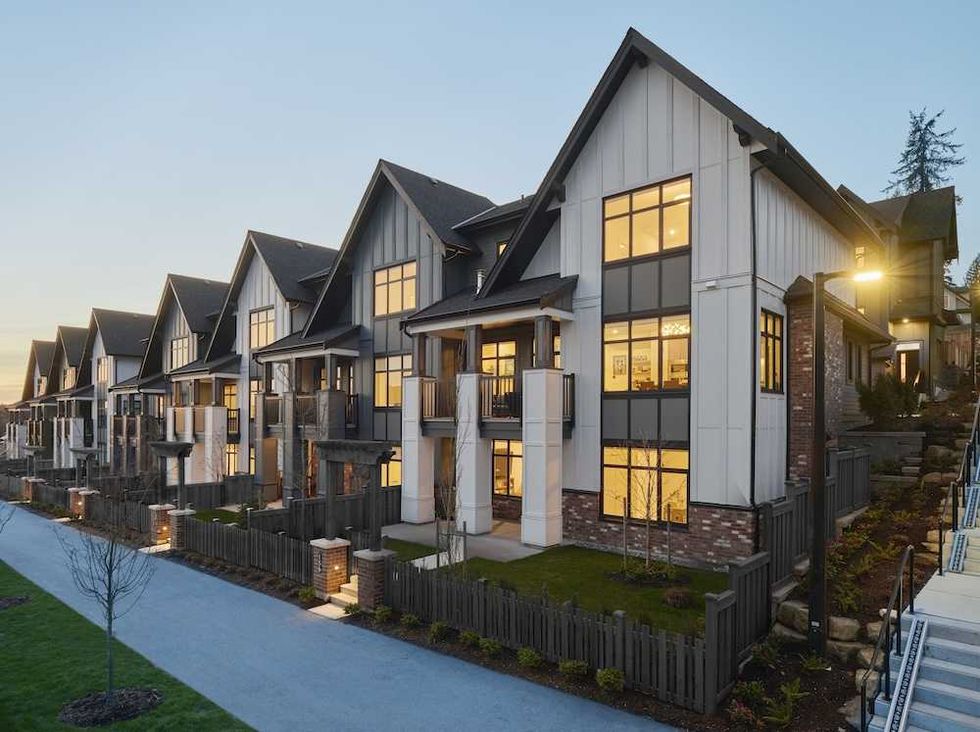 Versant (Infinity Properties)







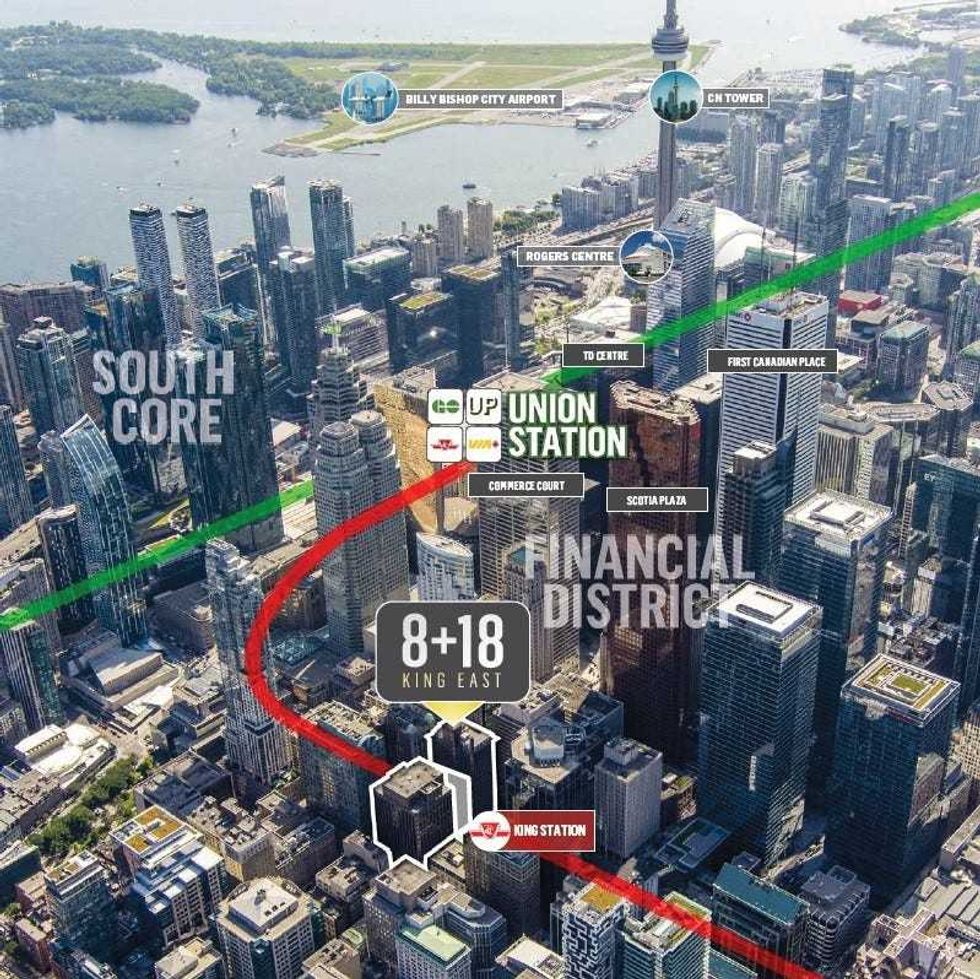 8 and 18 King Street East in Toronto. (RBC Capital Markets Realty)
 Interior photos of 8 and 18 King Street East. (RBC Capital Markets Realty)

 Narrow Fourplex (City of Toronto)
 Wide Sixplex - Side View (City of Toronto)