Toronto’s housing market is settling into an uneasy standoff.
Buyers still have negotiating leverage. Prices are still moving lower. But a growing number of homeowners appear to be deciding that, at today’s prices, they would rather not sell at all.
 Source: TheHabistat.com via TRREB/PropTX
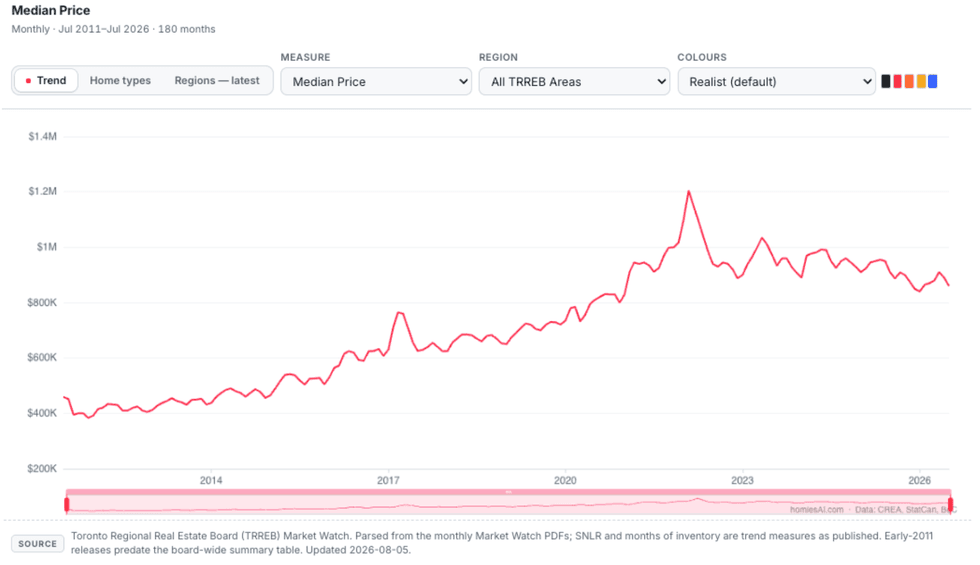
The average GTA home changed hands for $1,003,956 in July, according to the Toronto Regional Real Estate Board (TRREB). That was 4.5% below July 2025 and $54,972 below June’s average of $1,058,928.
On paper, that amounts to a 5.2% decline in a single month.
 Source: TRREB Marketwatch via homiesai.com ai harness for realtors
That figure should not be read in isolation. Monthly averages can be distorted by seasonality, and by changes in the types of homes being sold. July and August are typically slower months, particularly for larger family homes, and a smaller share of high-end transactions can pull the overall average down quickly.
Even so, the broader measures confirm the direction of travel. TRREB’s benchmark home price was 4.6% lower than a year earlier. July’s average may overstate the speed of the correction, but it does not change the underlying story: GTA home prices remain under pressure, and sellers have yet to find a durable floor.
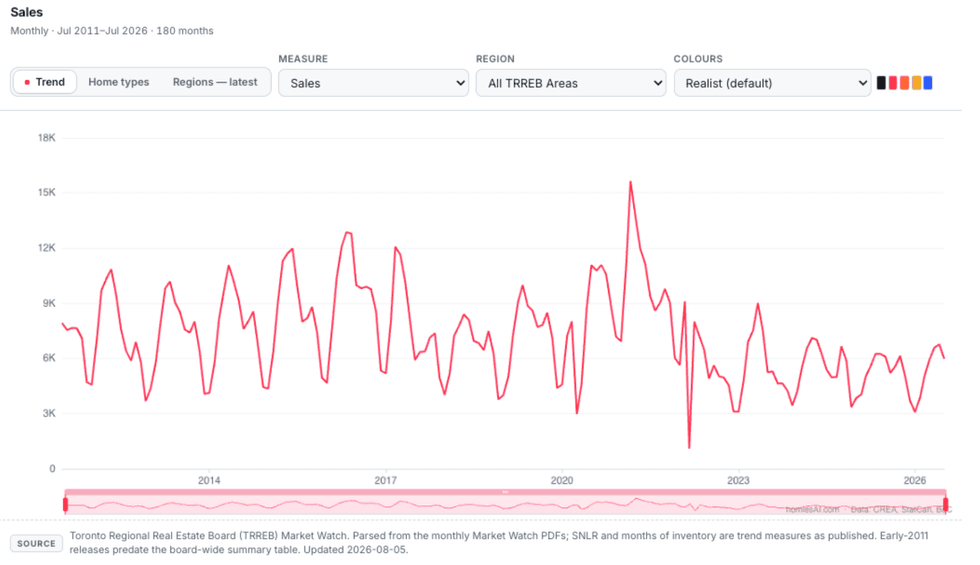
Sales were subdued rather than collapsing. The GTA recorded 5,995 transactions, just 0.9% fewer than last July. But homes took longer to sell, and the deals that did close generally required more compromise.
 Source: TRREB Marketwatch via homiesai.com ai harness for realtors
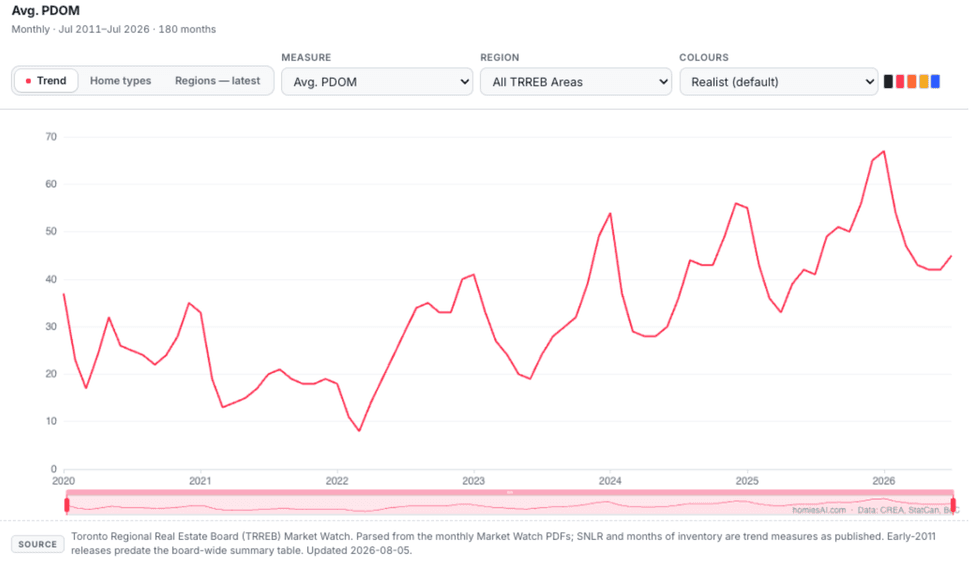
Total property days on market rose from 40 to 45, while the average transaction closed at 97% of the latest asking price. These are not the numbers of a market in freefall. They are the numbers of a market in which buyers still have time, choice, and the ability to walk away.
 Source: TRREB Marketwatch via homiesai.com ai harness for realtors
Detached Homes Exposed The Affordability Ceiling
The clearest weakness appeared in the detached market.
In the 905, the average detached home sold for $1,207,295 in July, down from $1,272,842 in June. That represents a one-month decline of $65,547, or 5.1%.
It was the largest monthly drop among the four major 905 housing categories. Average prices for semi-detached homes, townhouses, and condominium apartments each declined by less than 1.5%.
Toronto’s detached average fell even further in raw dollar terms, declining by roughly $100,000, or 6.1%, from June. But the 905 result provides the more meaningful market signal because it was based on substantially more activity: 2,098 detached sales, compared with 691 in the 416.
Some of the monthly decline can be explained by the calendar. Families purchasing larger homes often prefer to transact in the spring so they can move between school years. During the summer, fewer expensive properties may change hands, pulling down the average even when the value of an individual home has not fallen by the same amount.
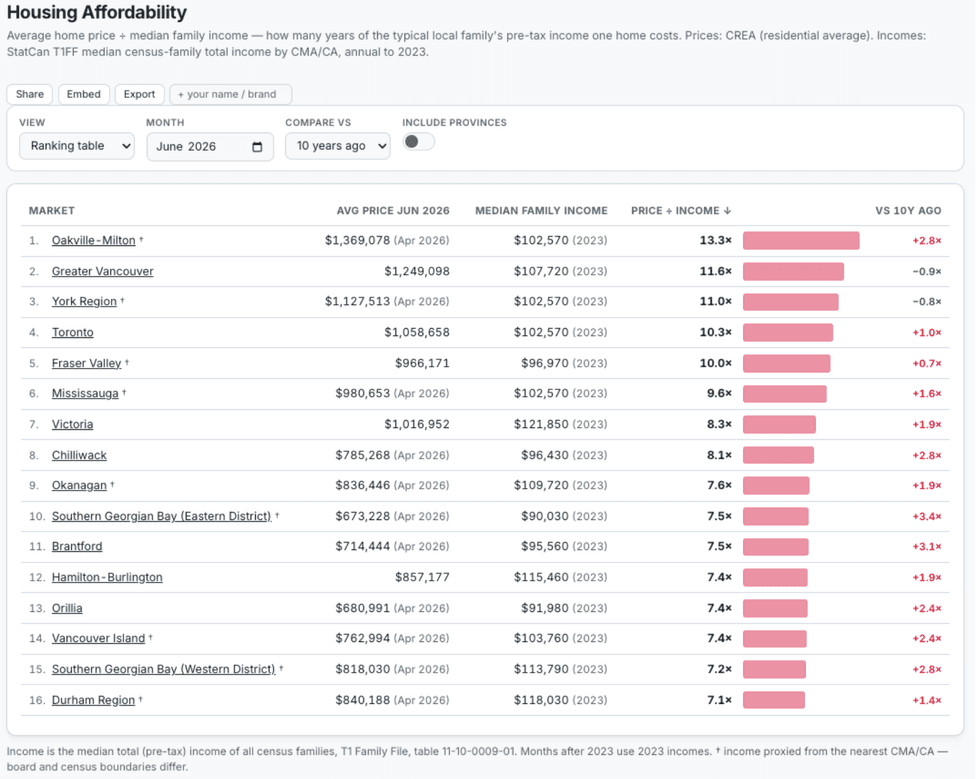
But seasonality is not the entire explanation. Detached homes also sit directly beneath the GTA’s affordability ceiling. All of the markets that are performing the worst in Canada are, basically, the most unaffordable markets:
 Source: CREA Stats via homiesai.com ai harness for realtors
Even after recent price declines, a purchase near $1.2 million requires substantial income, equity, and monthly carrying capacity. Many prospective buyers must also sell an existing property before they can complete the next purchase.
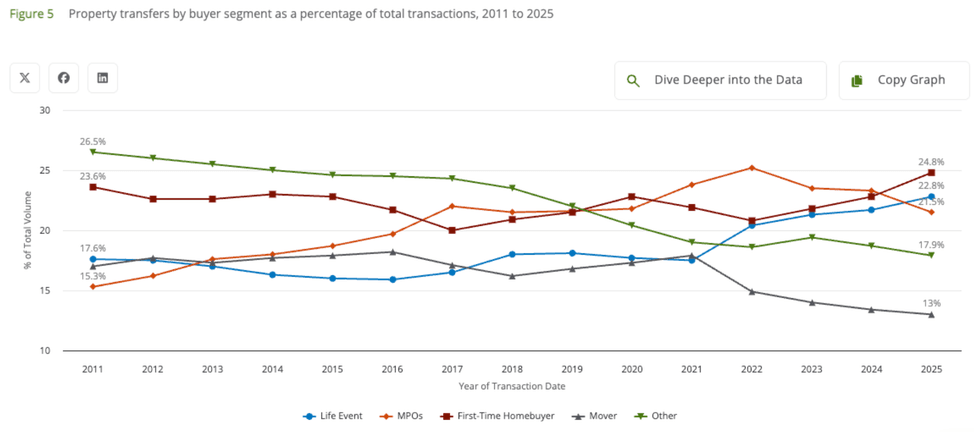
The move-up market functions as a chain. A first-time buyer purchases an entry-level property, allowing that seller to move into a larger home, which allows the next owner to move again. When the first transaction fails, the rest of the chain can stall with it. While Teranet observed that first-time buyers are more active than they’ve ever been as a total share of the market, we’re still near record low volume… so their total number is still lower than it has been in the past:
 Source: Teranet Q1 2026 Market Insights (https://teraintelligence.teranet.ca/market_insights/market-insights-q1-2026/)
That is how a market becomes illiquid without sales necessarily collapsing outright. Buyers still exist, but fewer of them can complete the sequence of transactions required to reach the detached segment.
Sellers Are Shrinking The Market
July’s most important development may not have been the price decline. It was the response from sellers.
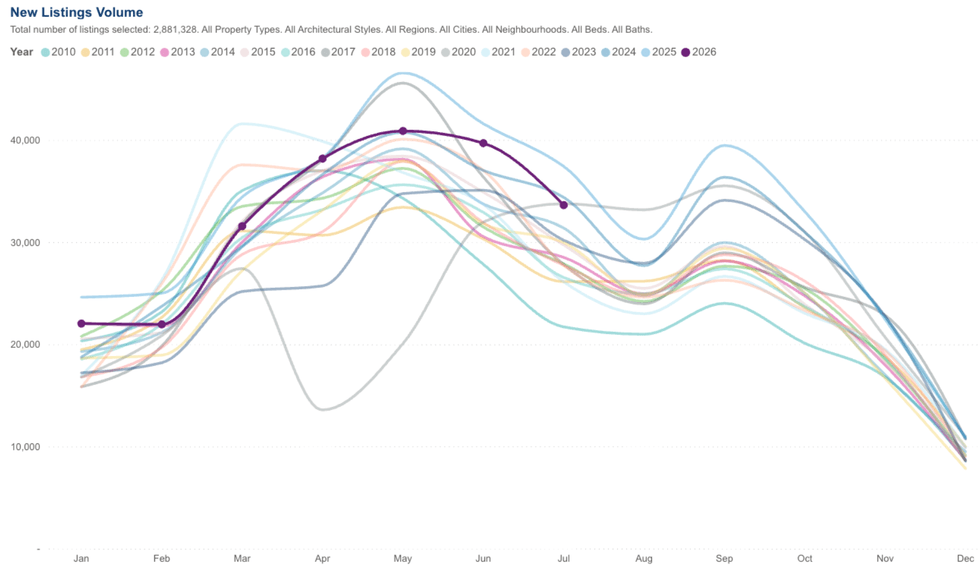
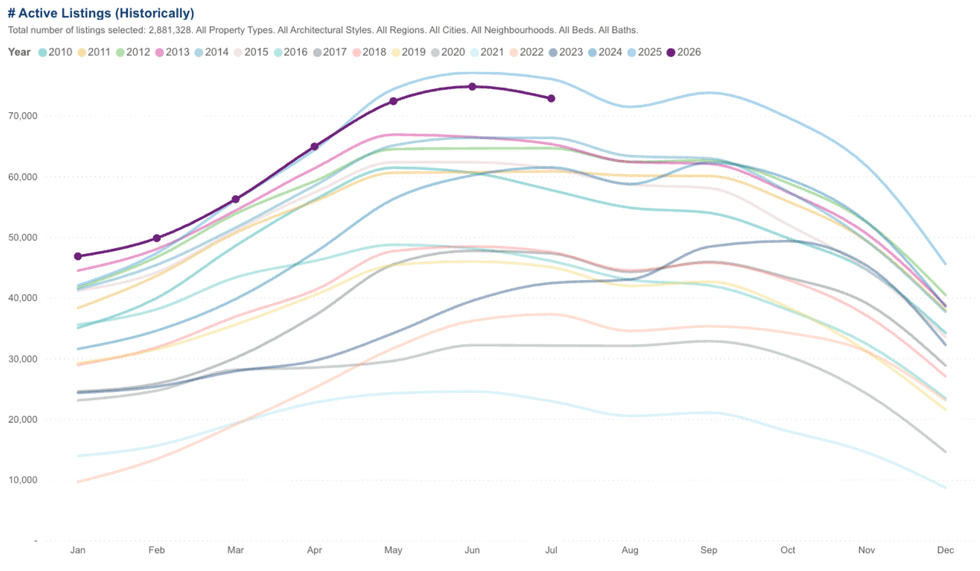
New listings fell 17.8% year over year to 14,484. Active listings declined 12.1% to 26,098. Sales, by comparison, slipped by only 0.9%.
Supply therefore contracted much faster than demand. Active listings are now trending below last year’s numbers for 3 months in a row, as sellers make their final adjustment in response to buyers’ unwillingness to pay more. Rather than lowering the price, many sellers are just leaving the market.
 Source: thehabistat.com via TRREB/PropTX
That imbalance created a modest amount of tightening. The sales-to-new-listings ratio edged up from 36.5% in June to 37.1% in July, while months of inventory declined from 4.7 to 4.6.
Neither move was large enough to restore seller pricing power. Buyers still had meaningful selection, room to negotiate, and little reason to chase an aggressively priced property. But the mechanism behind the tightening is important.
A market that tightens because buyers are rushing back is one thing. A market that tightens because sellers are withdrawing is something very different.
TRREB’s Market Watch report does not provide a count of terminated or suspended listings, but The Habistat shows that sellers are cancelling listings less than last year, but still at the second-fastest rate on record:
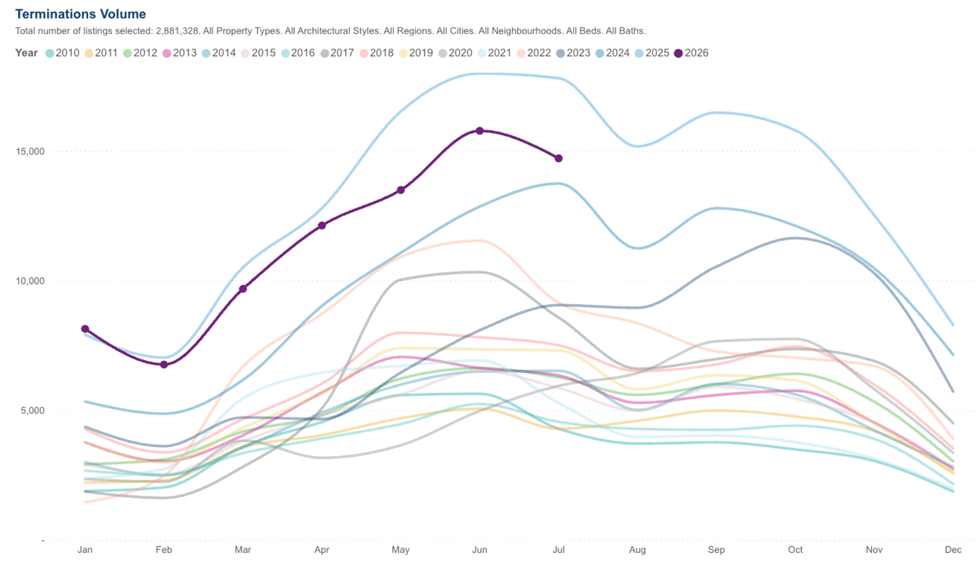
The sharp decline in both new and active listings nevertheless supports a reasonable inference: some owners are delaying their sale, removing unsuccessful listings, or deciding not to enter the market after seeing what comparable homes are fetching.
In other words, sellers are beginning to ration supply rather than accept the market’s current clearing price.
That can eventually help stabilize prices, but it is not the same as a demand-led recovery. Completed transactions are still establishing lower comparables. The market is becoming slightly tighter because fewer owners are volunteering to sell into weakness, not because buyers have suddenly regained confidence or purchasing power.
The Fall Market Will Be A Test Of Patience
The fall market will come down to which side of this standoff moves first.
Sellers will see fewer competing listings and may interpret that as a reason to hold firm. Buyers will point to July’s lower closing prices, longer selling times, and persistent affordability pressure. Both sides will believe time is working in their favour.
Three indicators will help determine who is right.
First, active inventory must continue to decline. One month of lower listings can reflect seasonality; a sustained contraction would signal that sellers are meaningfully reducing the supply available to buyers.
Second, the benchmark price needs to produce several consecutive firm readings. A single seasonally adjusted increase would not be enough to establish a floor after a prolonged correction.
Third, the 905 detached market needs to stabilize. Its size, price point, and dependence on move-up buyers make it one of the clearest stress tests for the wider GTA housing market.
Continued seller withdrawals could gradually narrow buyer choice and slow the pace of price declines, even without a significant rebound in sales. But if inventory stops falling while demand remains weak, July’s lower transactions will become the comparables against which fall listings are judged.
That is the risk for sellers waiting for the market to improve: every completed sale at a lower price resets expectations for the next one.
For now, buyers control the negotiation, while sellers control whether their homes appear on the market at all. That tension is beginning to reduce supply, but it has not yet stopped the GTA’s downward price grind.