Draw Schedule
Learn about draw schedules in Canadian construction financing — what they are, how they work, and why they reduce risk.

July 28, 2025
What is a Draw Schedule?
A draw schedule is a payment plan used in construction financing that outlines when and how funds will be released to the builder or contractor as work progresses.
Why Draw Schedules Matter in Real Estate
In Canadian construction, draw schedules help lenders control risk by tying disbursements to project milestones verified by inspections.
Key features:
- Payments released at defined stages (e.g., foundation, framing)
- Reduces risk of incomplete or faulty work
- Ensures project cash flow aligns with progress
Understanding draw schedules helps developers and contractors manage expectations and maintain project timelines.
Example of a Draw Schedule in Action
The construction loan included a draw schedule releasing funds after each stage was inspected and approved by the lender.
Key Takeaways
- Ties construction funding to progress milestones
- Reduces lender and owner risk
- Requires inspections to trigger payments
- Helps maintain cash flow discipline
- Common in construction loans and contracts
Related Terms
- Construction Loan
- Holdback (Construction Financing)
- Hard Costs (Construction)
- Soft Costs (Construction)
- Permanent Financing


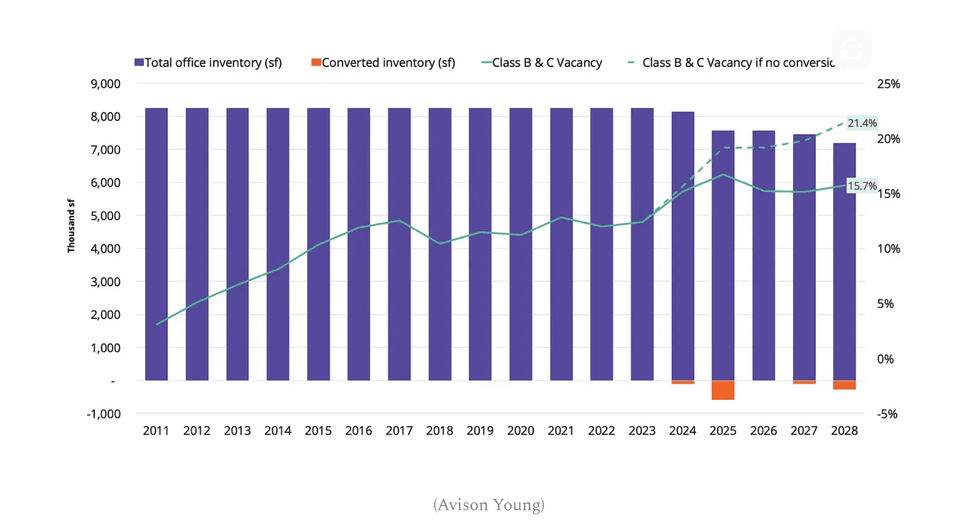 (Avison Young)






 The Mason Suite Interior (Infinity Properties)
 The Mason Suite Interior (Infinity Properties)
 Rail District aerial (Infinity Properties)
 Versant (Infinity Properties)


 Narrow Fourplex (City of Toronto)
 Wide Sixplex - Side View (City of Toronto)
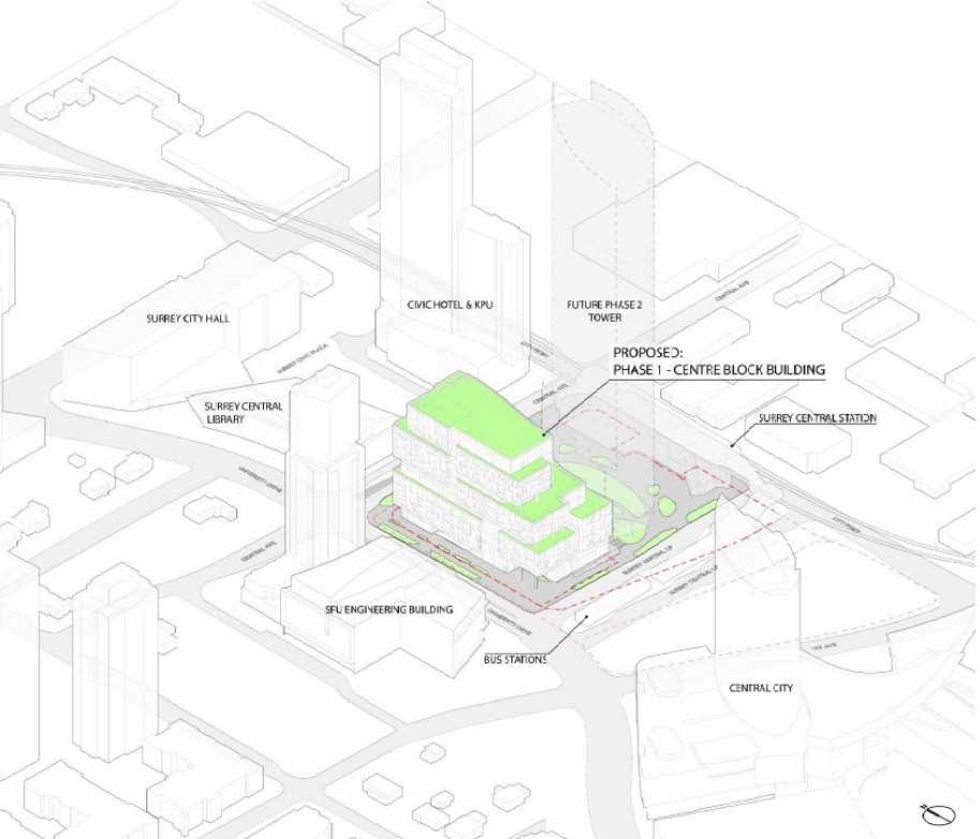 Centre Block and its surrounding context. (Stantec-Revery, SCDC)
 The 12-storey Phase One of Centre Block. (Stantec-Revery, SCDC)
 The 12-storey Phase One of Centre Block. (Stantec-Revery, SCDC)
 Mondria One, set for 1607 King Street East in Clarington, Ontario. (ICON Architects Inc., Monde Development Group)