Absorption Rate Analysis
Understand absorption rate analysis in Canadian real estate — what it is, why it matters, and how it supports market forecasting.

August 01, 2025
What is Absorption Rate Analysis?
Absorption rate analysis is the evaluation of how quickly available properties in a given market are being sold or leased during a specific time period.
Why Absorption Rate Analysis Matters in Real Estate
In Canadian real estate, absorption rate analysis provides valuable insights into market demand, inventory levels, and price trends.
Uses include:
- Identifying if the market favours buyers or sellers
- Helping developers plan the release of new projects
- Informing investment decisions and valuations
Understanding absorption rate analysis helps industry professionals forecast market conditions and adjust strategies.
Example of Absorption Rate Analysis in Action
An absorption rate analysis revealed that the city's condos were selling faster than new units were coming to market, suggesting strong demand.
Key Takeaways
- Measures the pace of property sales or leases
- Indicates market demand and competition
- Assists developers and investors in making strategic decisions
- Guides pricing and marketing efforts
- Useful for predicting market shifts
Related Terms
- Vacancy Rate
- Housing Inventory
- Sales-to-New-Listings Ratio (SNLR)
- Market Trends
- Absorption Cost





















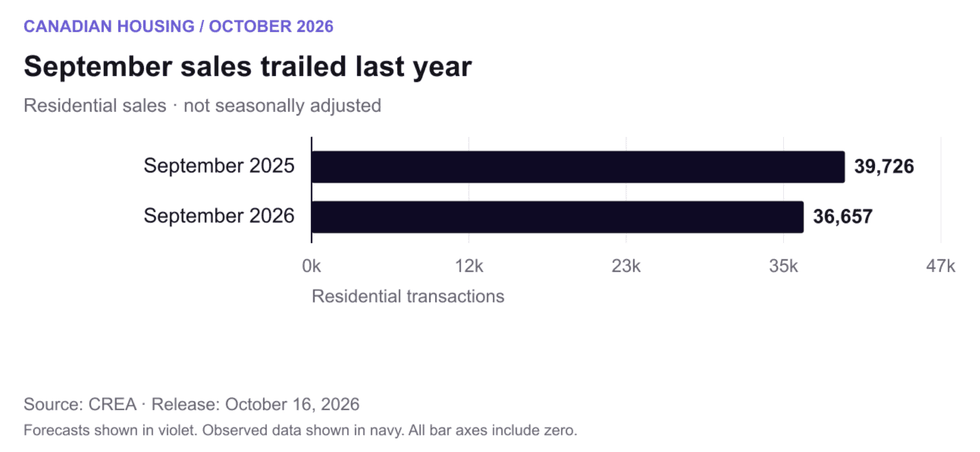 September residential sales, not seasonally adjusted; the annual comparison uses CREA’s revised figures. Chart:
 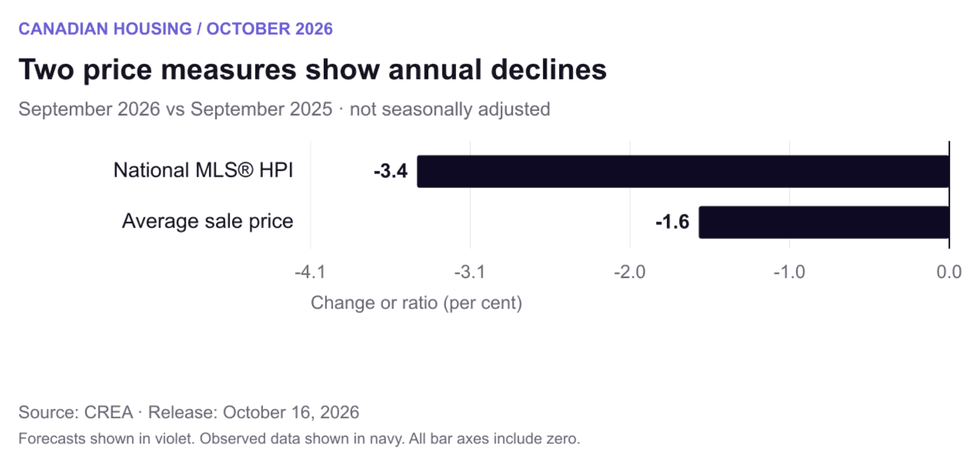 Annual changes in the unadjusted national MLS® HPI and average sale price. The average is affected by the mix of transactions. Chart:
 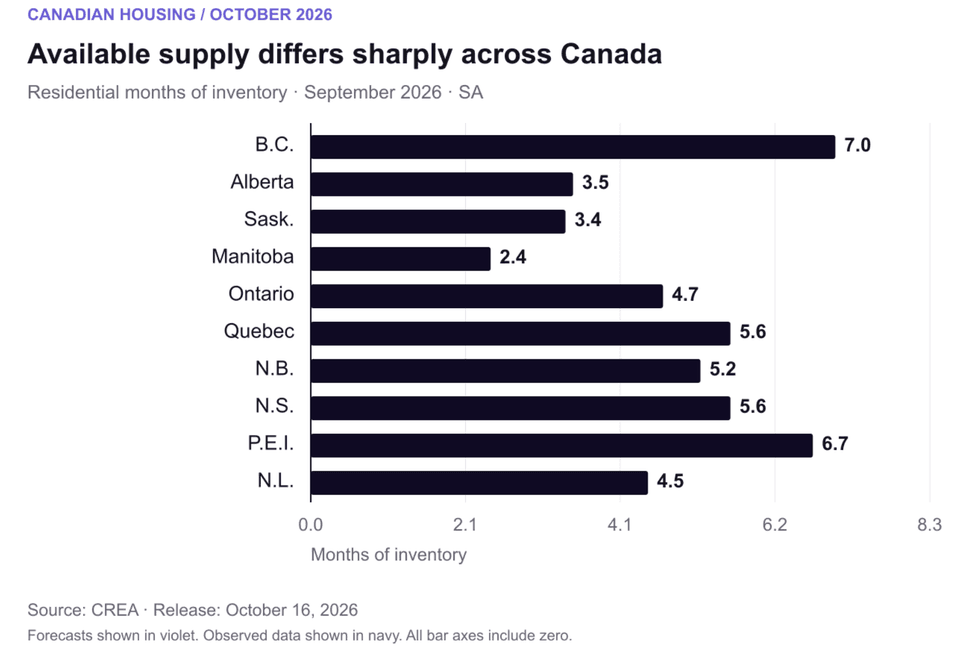 Seasonally adjusted residential months of inventory by province. Local property types can differ substantially. Chart:
 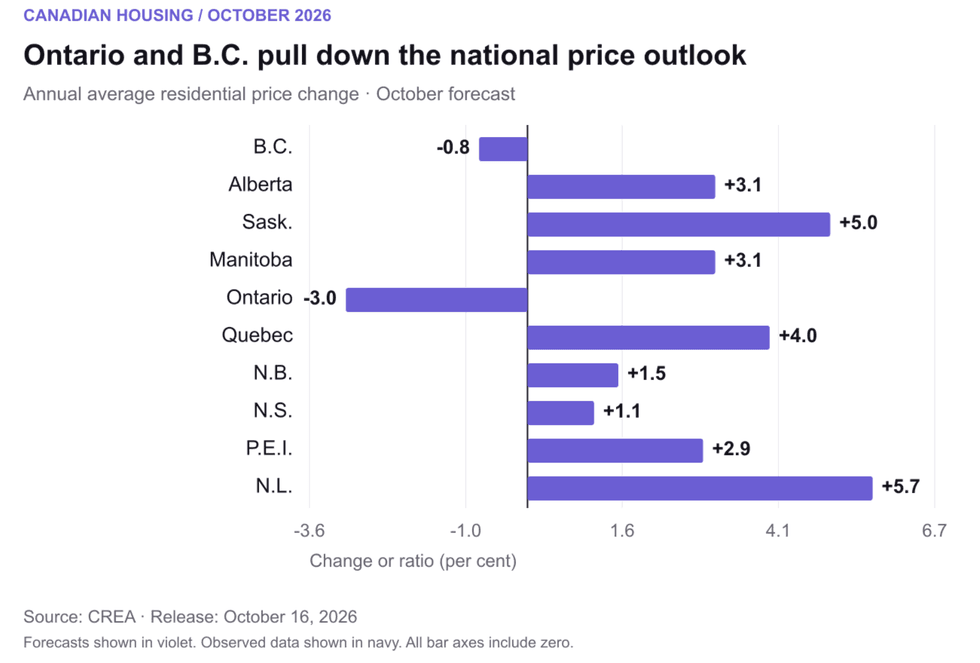 Ontario and B.C. are the two provinces with forecast annual average-price declines in 2026. Chart:
 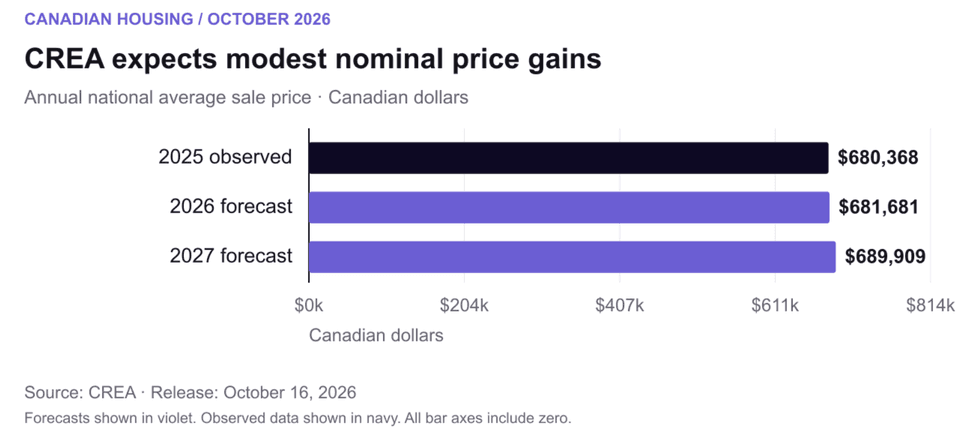 Annual average transaction prices in Canadian dollars. Forecast values are not December price targets. Chart:
 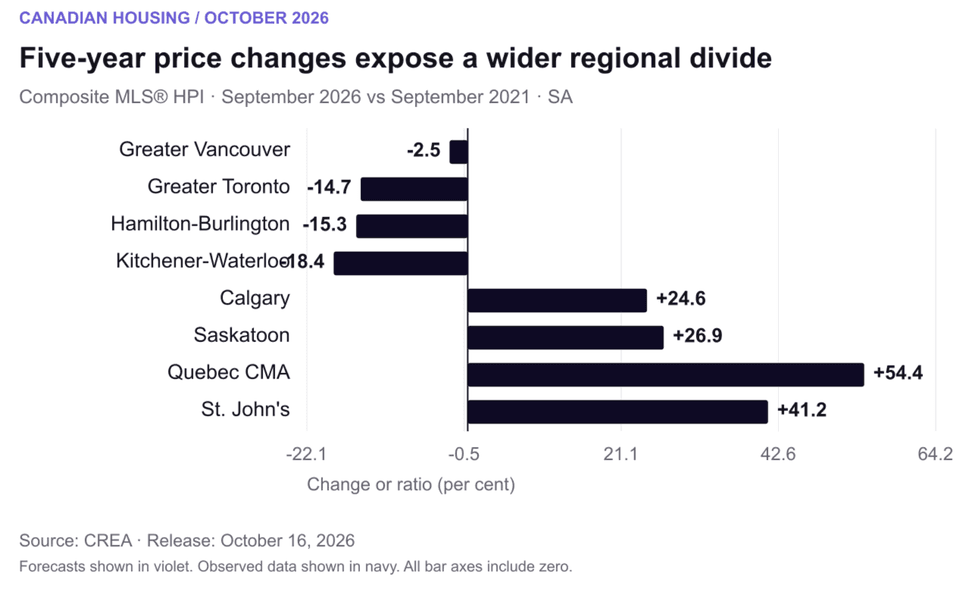 Five-year changes in seasonally adjusted composite MLS® HPI benchmarks, September 2021 to September 2026. Chart: