Appreciation Rate
Learn what appreciation rate means in Canadian real estate, how it's calculated, and why it’s vital for homebuyers and property investors.
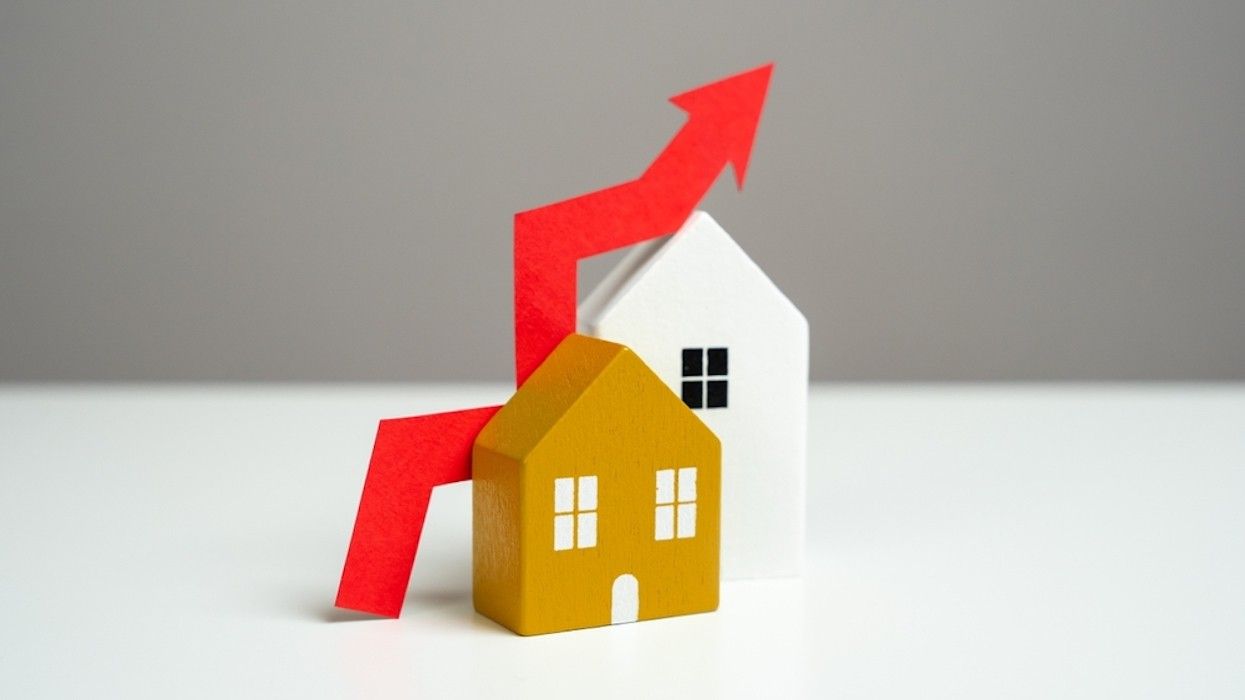
May 22, 2025
What is an Appreciation Rate?
Appreciation rate refers to the percentage increase in a property's value over a specific period of time, typically expressed annually.
Why Appreciation Rates Matter in Real Estate
In Canadian real estate, the appreciation rate is a key indicator of a property's investment potential. A high appreciation rate means the property has increased in value significantly, which can translate into greater equity for the homeowner and higher returns for investors.
Several factors influence a property’s appreciation rate, including:
- Location and neighbourhood development
- Economic conditions and employment trends
- Supply and demand in the housing market
- Interest rates and lending policies
- Infrastructure improvements (transit, schools, parks)
Example of the Appreciation Rate in Action
A condo purchased in 2018 for $400,000 is valued at $500,000 in 2023. The annual appreciation rate is approximately 4.56%.
Key Takeaways
- Measures how much a property’s value increases over time.
- Expressed as an annual percentage.
- Influenced by location, economy, and demand.
- Important for homebuyers and real estate investors.
- Higher appreciation can mean greater equity and returns.
Related Terms
- Capital Appreciation
- Market Value
- Equity
- Return on Investment (ROI)
- Real Estate Investment

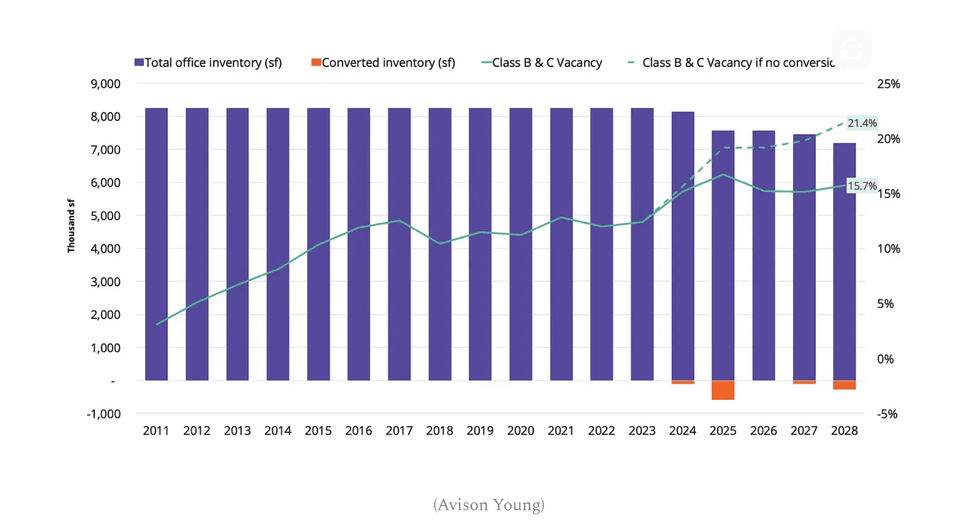 (Avison Young)


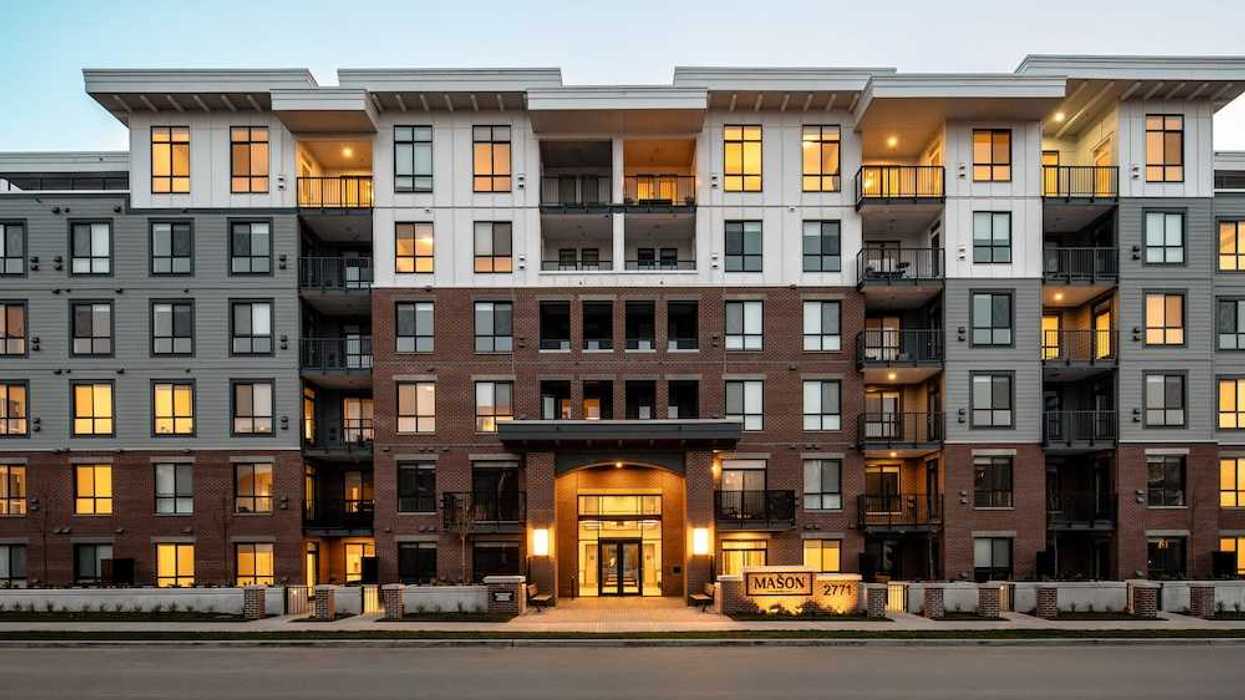
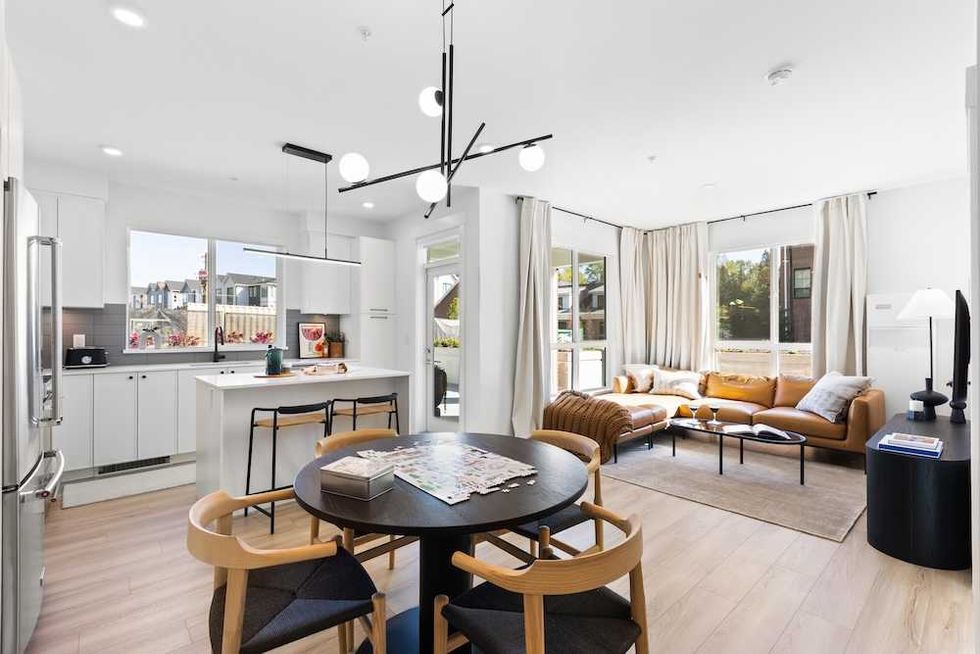 The Mason Suite Interior (Infinity Properties)
 The Mason Suite Interior (Infinity Properties)
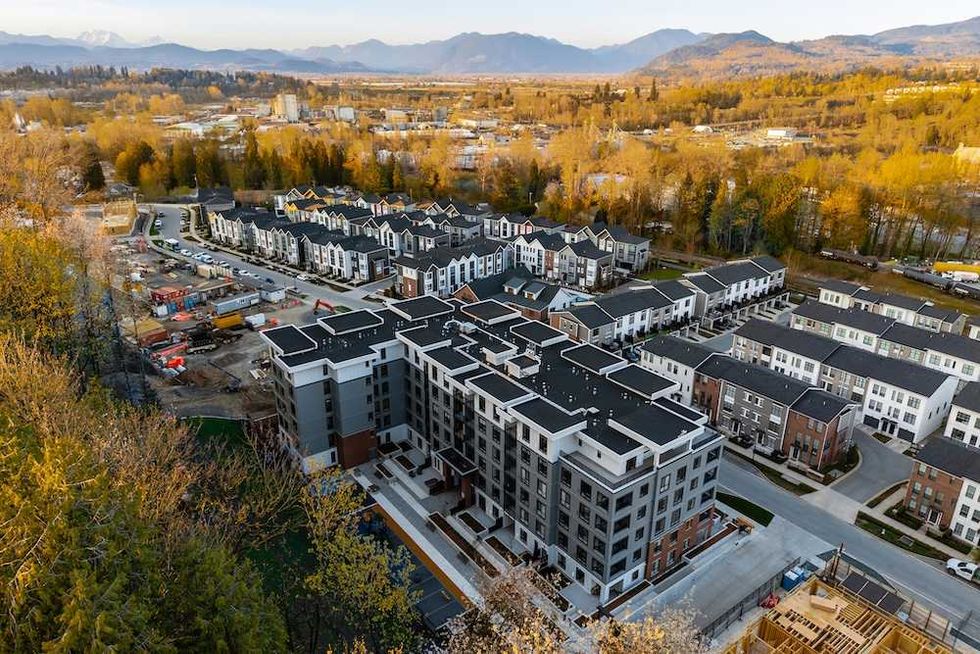 Rail District aerial (Infinity Properties)
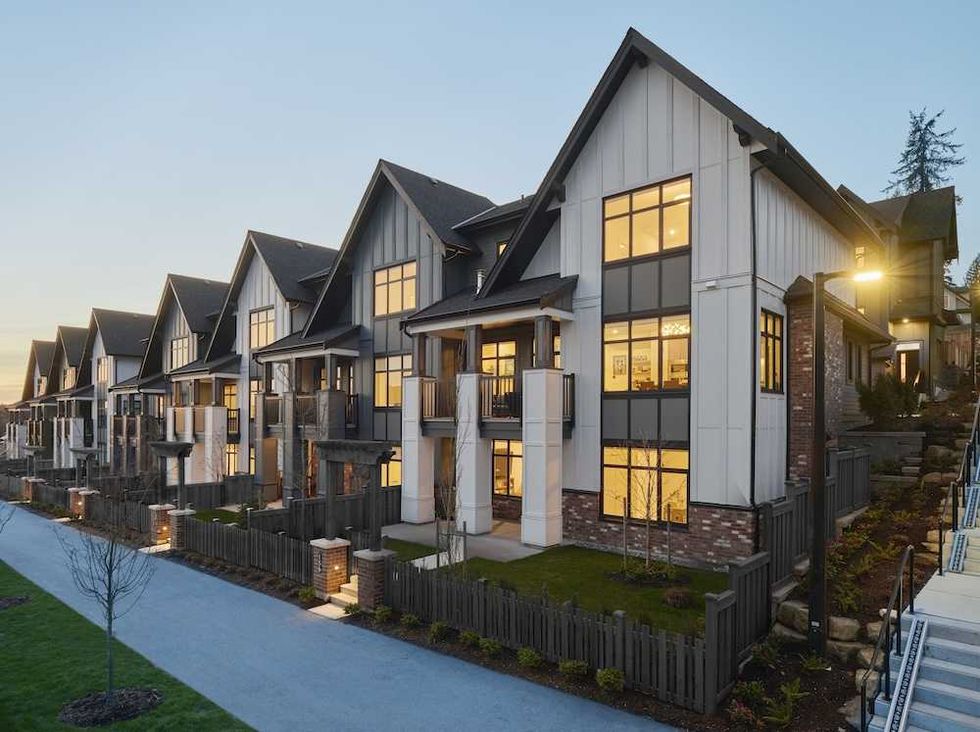 Versant (Infinity Properties)
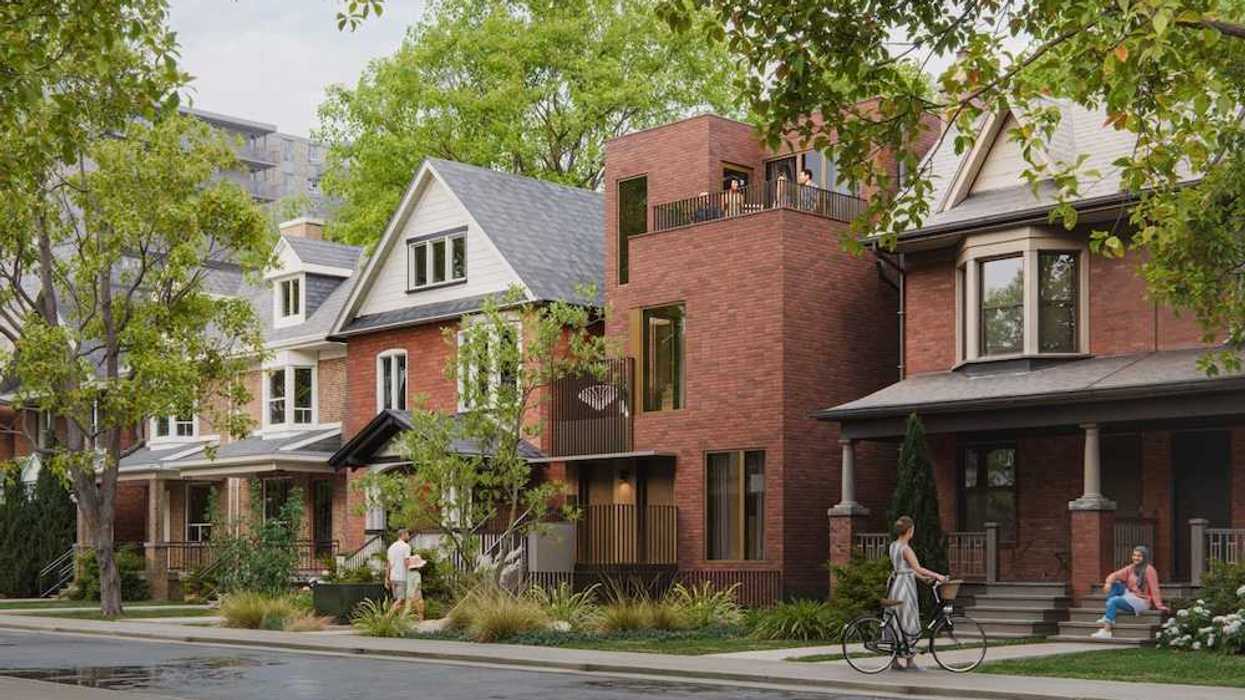
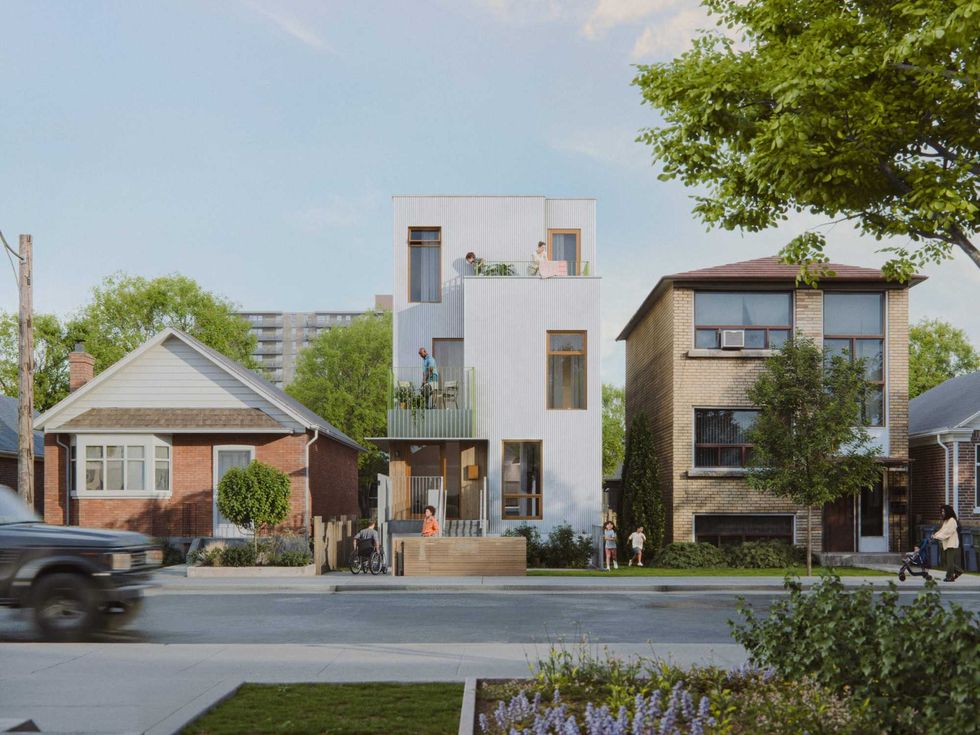 Narrow Fourplex (City of Toronto)
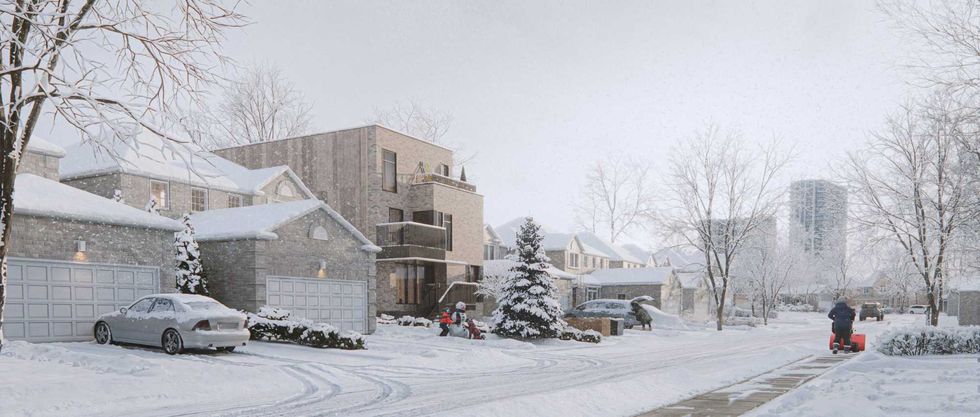 Wide Sixplex - Side View (City of Toronto)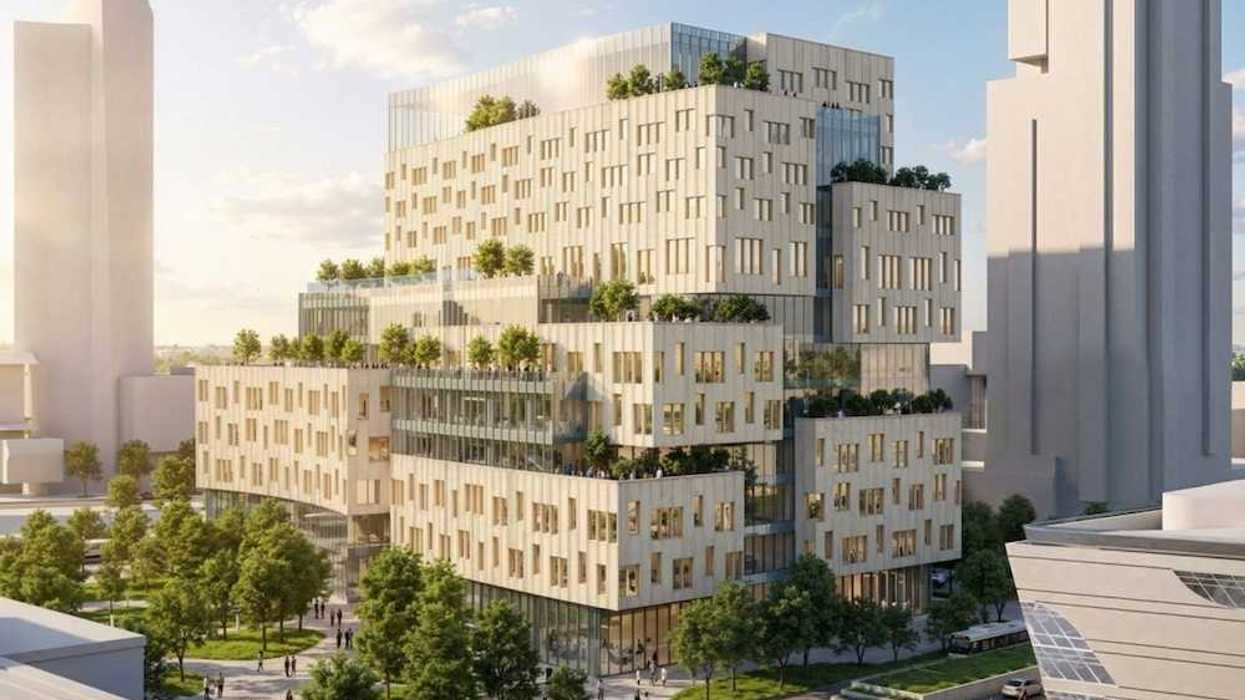
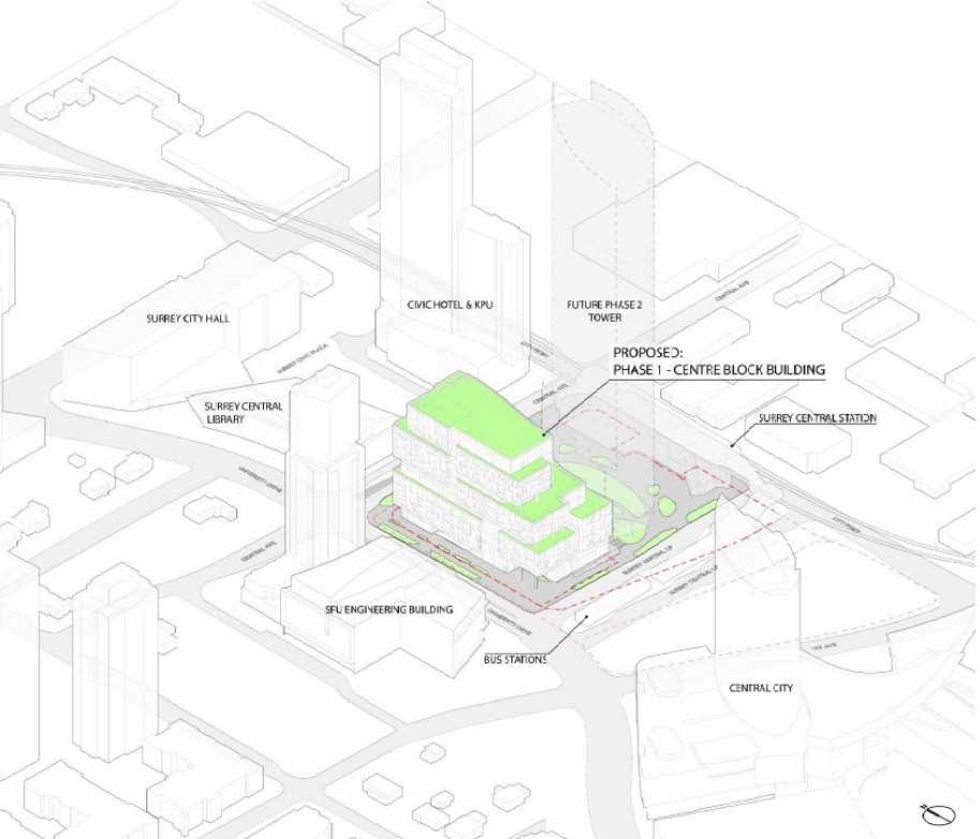 Centre Block and its surrounding context. (Stantec-Revery, SCDC)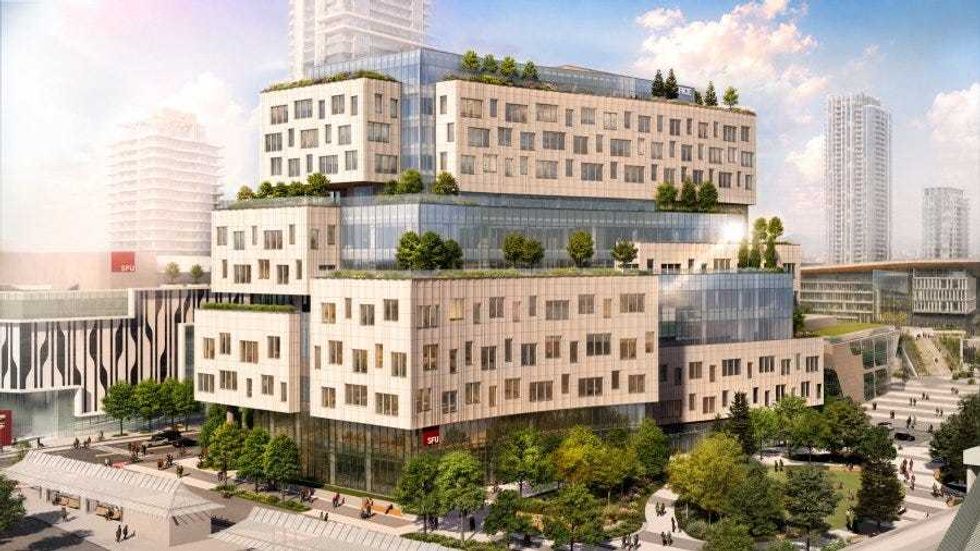
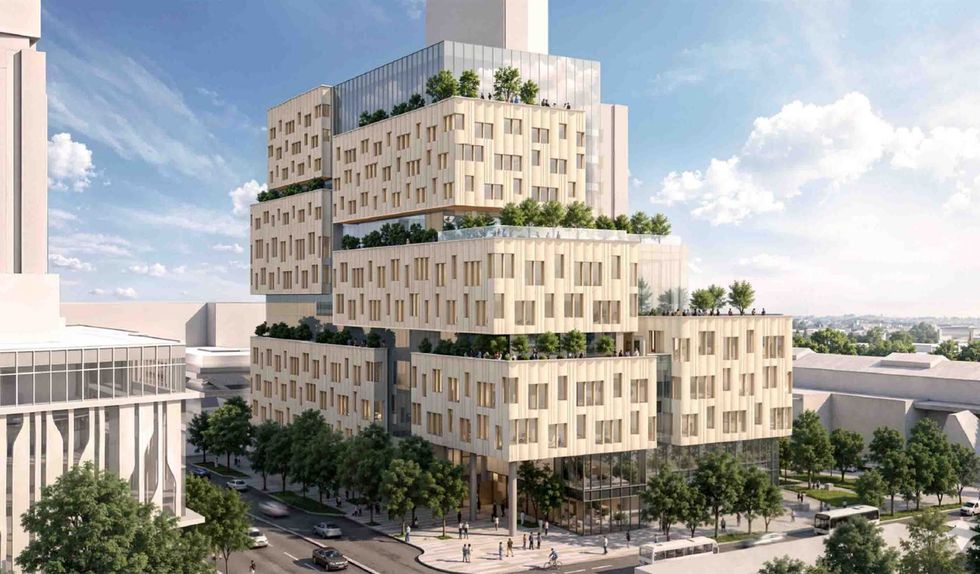 The 12-storey Phase One of Centre Block. (Stantec-Revery, SCDC)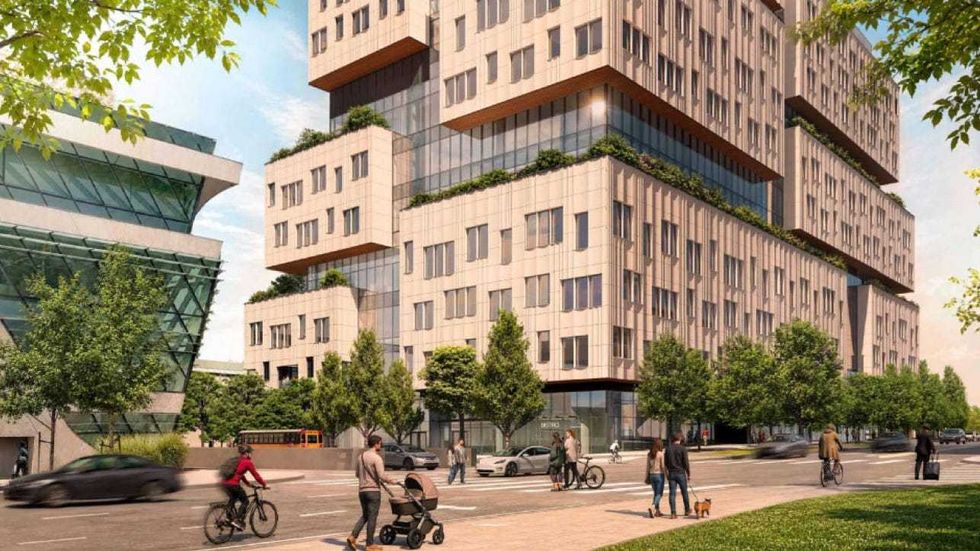
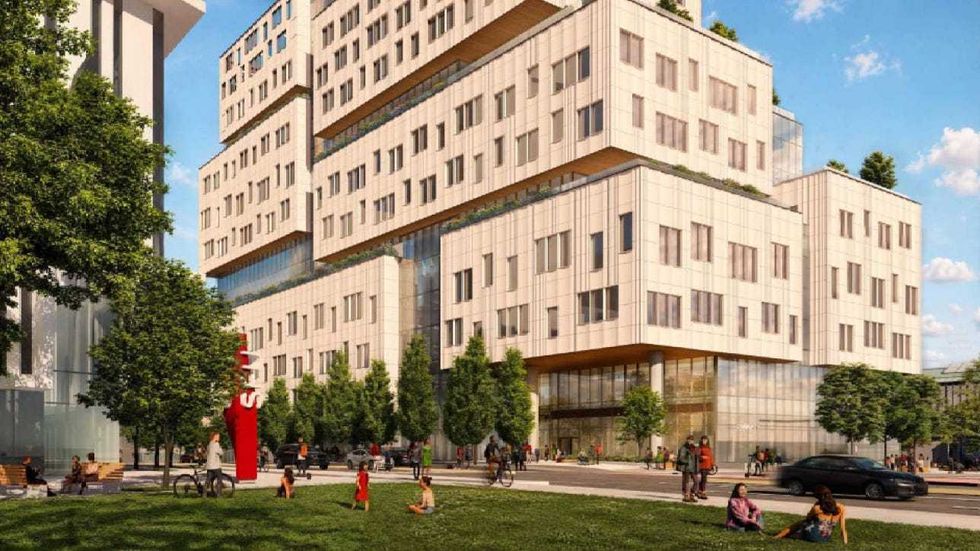 The 12-storey Phase One of Centre Block. (Stantec-Revery, SCDC)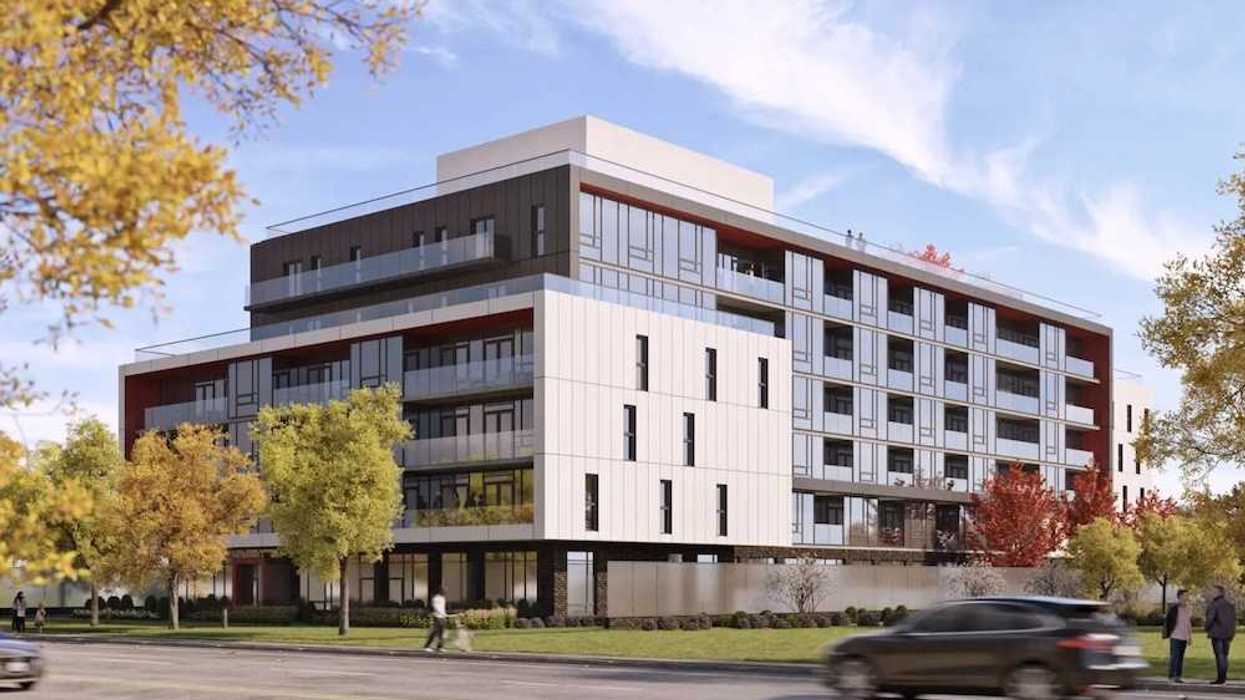
 Mondria One, set for 1607 King Street East in Clarington, Ontario. (ICON Architects Inc., Monde Development Group)