Gentrification
Understand gentrification in Canadian real estate — how urban renewal impacts neighbourhood value, housing access, and community dynamics.
June 09, 2025
What is Gentrification?
Gentrification is the process by which a traditionally lower-income neighbourhood undergoes revitalization and attracts higher-income residents, often leading to increased property values and the displacement of long-standing residents.
Why Gentrification Matters in Real Estate
In Canadian urban real estate, gentrification can reshape neighbourhood demographics, spur investment, and drive up housing costs.
Indicators of gentrification include:
- New developments and amenities (cafés, grocery stores)
- Influx of higher-income homeowners and renters
- Rising home prices and rent levels
- Redevelopment of aging housing stock
While gentrification can improve safety and infrastructure, it may also cause affordability issues and displace vulnerable communities.
Understanding gentrification helps buyers, investors, and policymakers weigh both market potential and social implications.
Example of Gentrification in Action
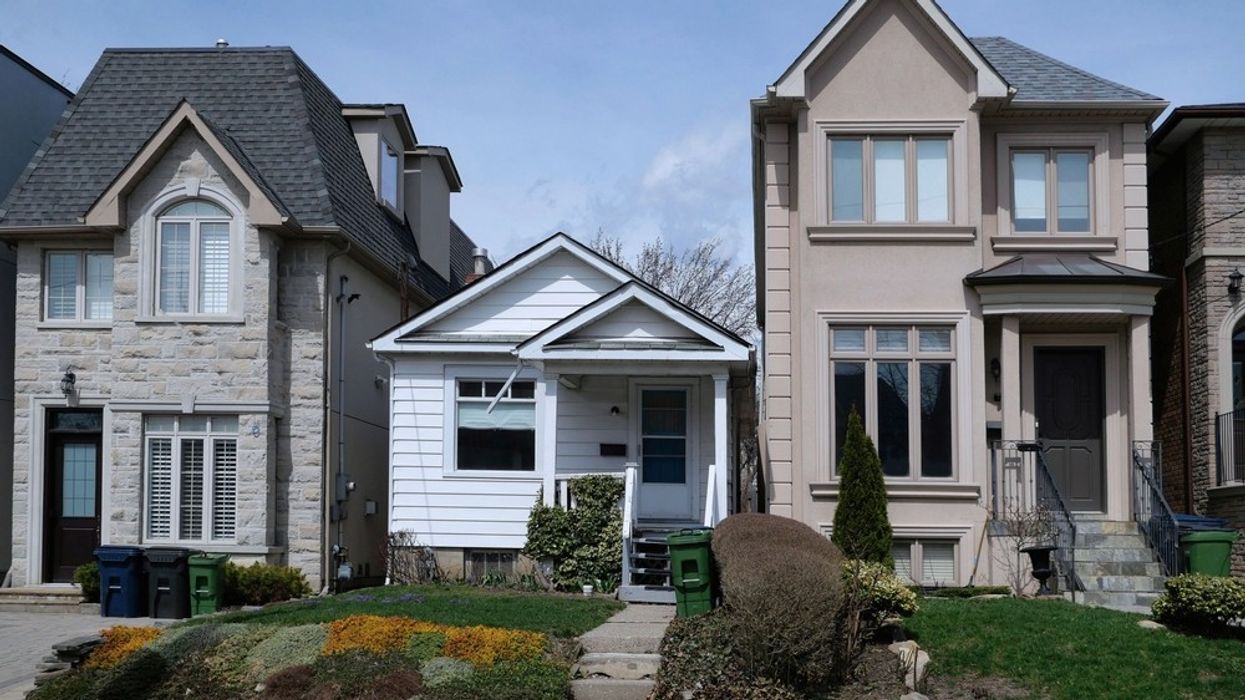
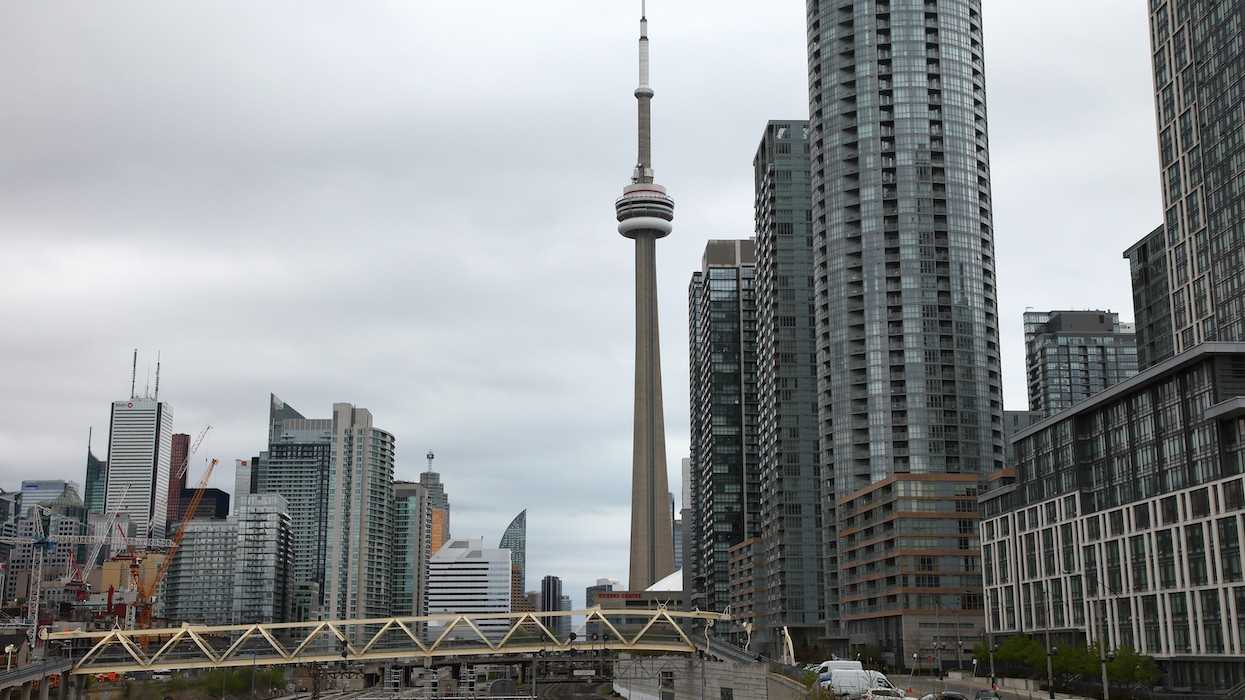
A once-industrial area near the city centre sees an influx of condo developments, creative businesses, and younger professionals, triggering gentrification.
Key Takeaways
- Raises property values and investment interest
- Can displace long-term, lower-income residents
- Often follows public infrastructure improvements
- Alters neighbourhood demographics and culture
- Balances opportunity with equity concerns
Related Terms
- Market Value
- Urban Planning
- Housing Affordability
- Revitalization
- Rental Displacement
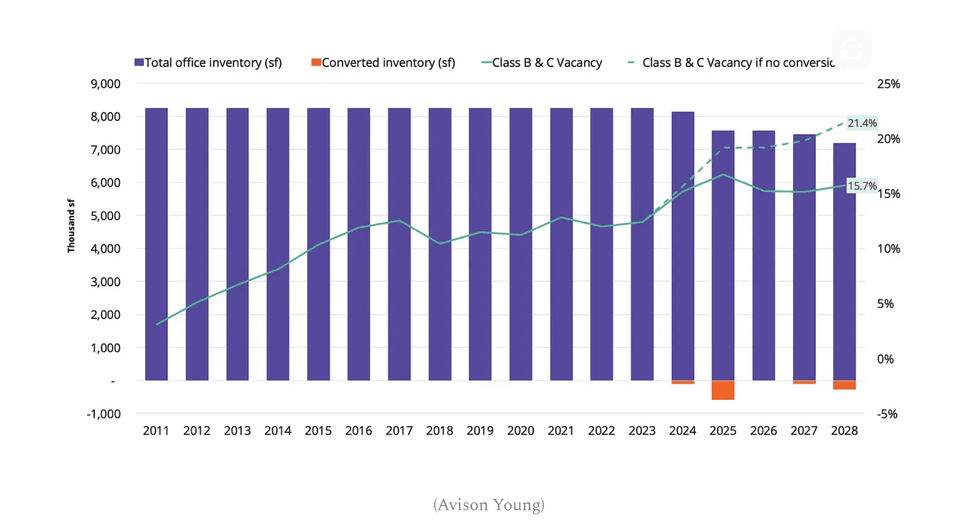 (Avison Young)
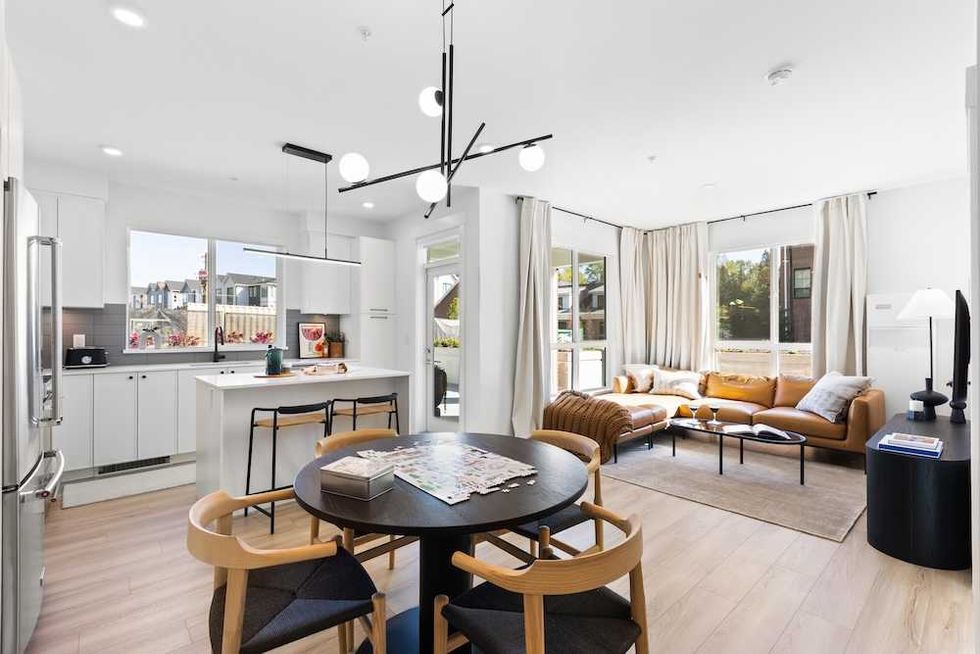 The Mason Suite Interior (Infinity Properties)
 The Mason Suite Interior (Infinity Properties)
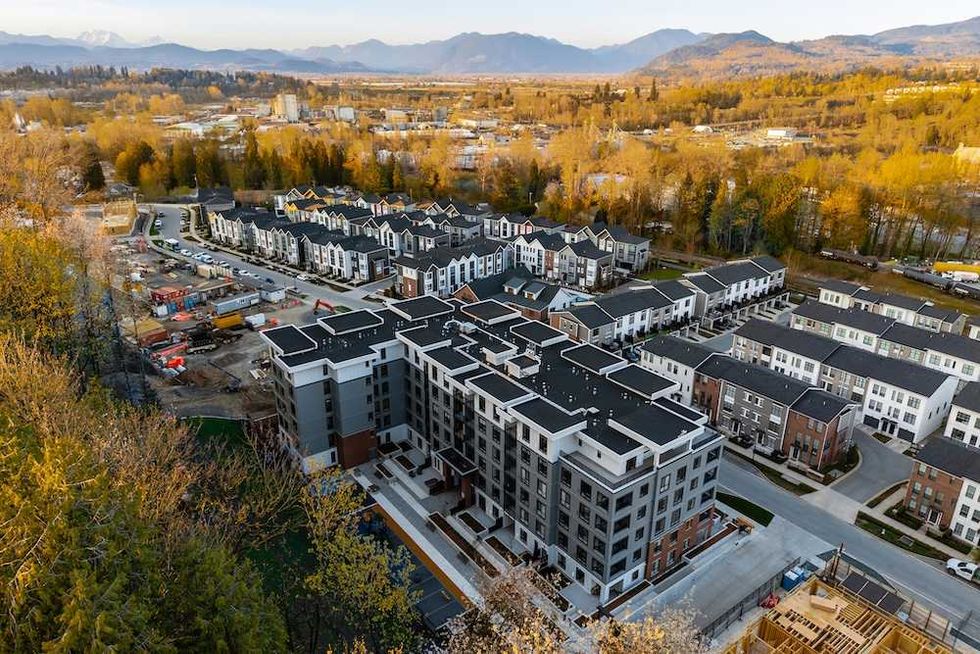 Rail District aerial (Infinity Properties)
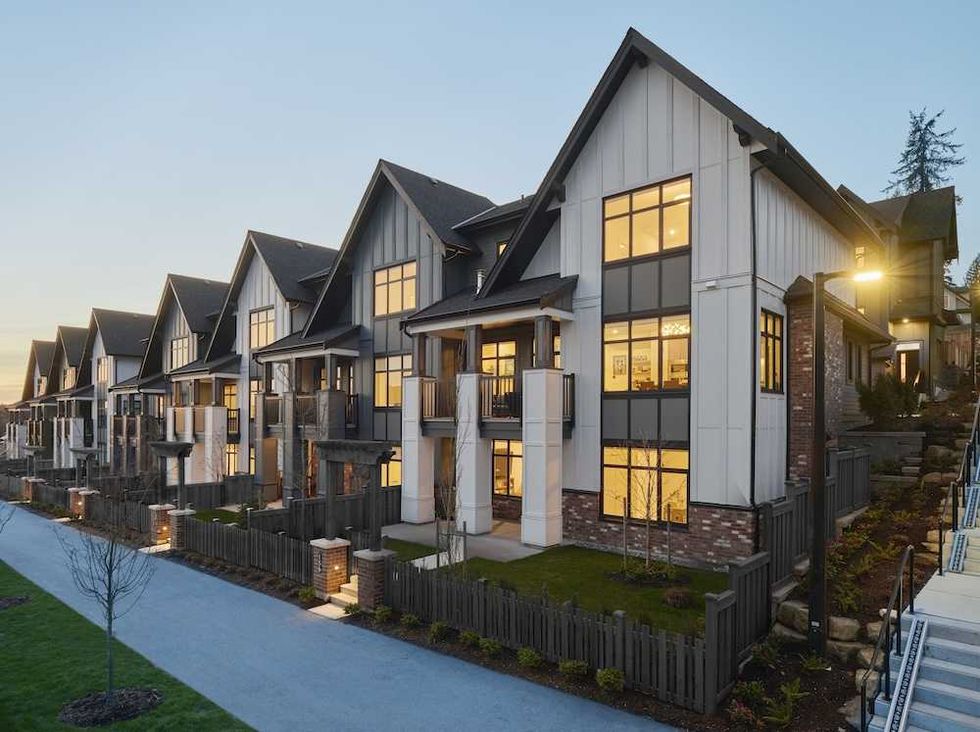 Versant (Infinity Properties)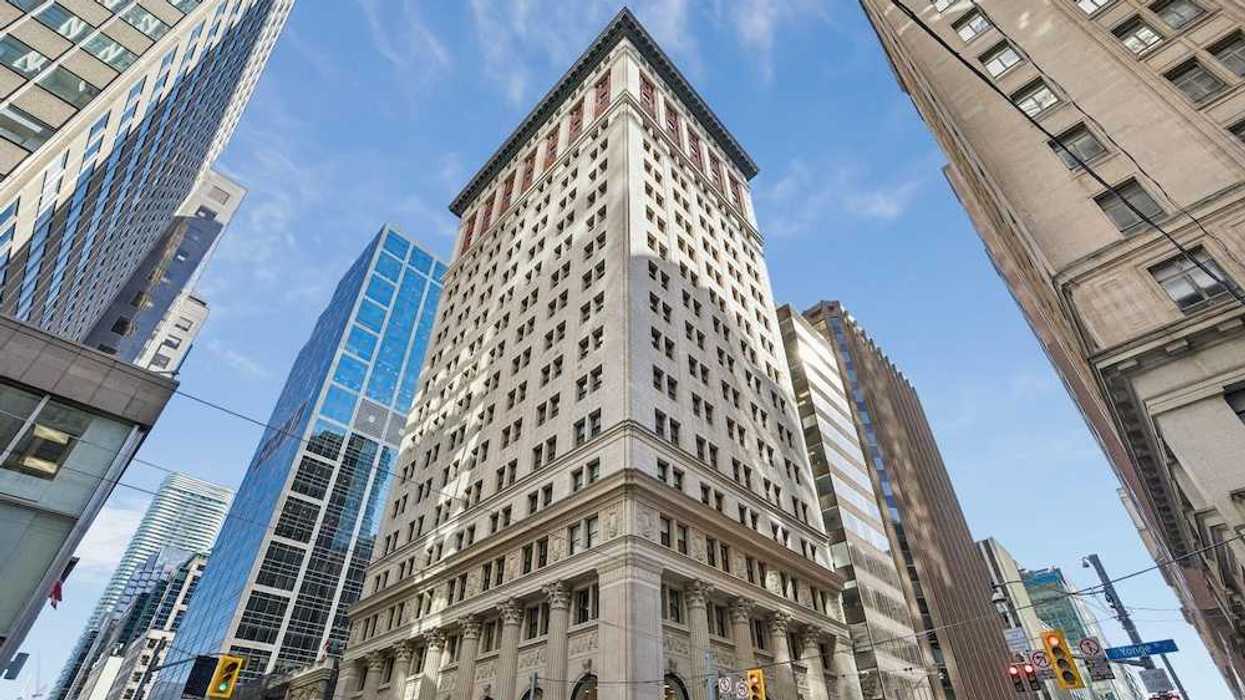



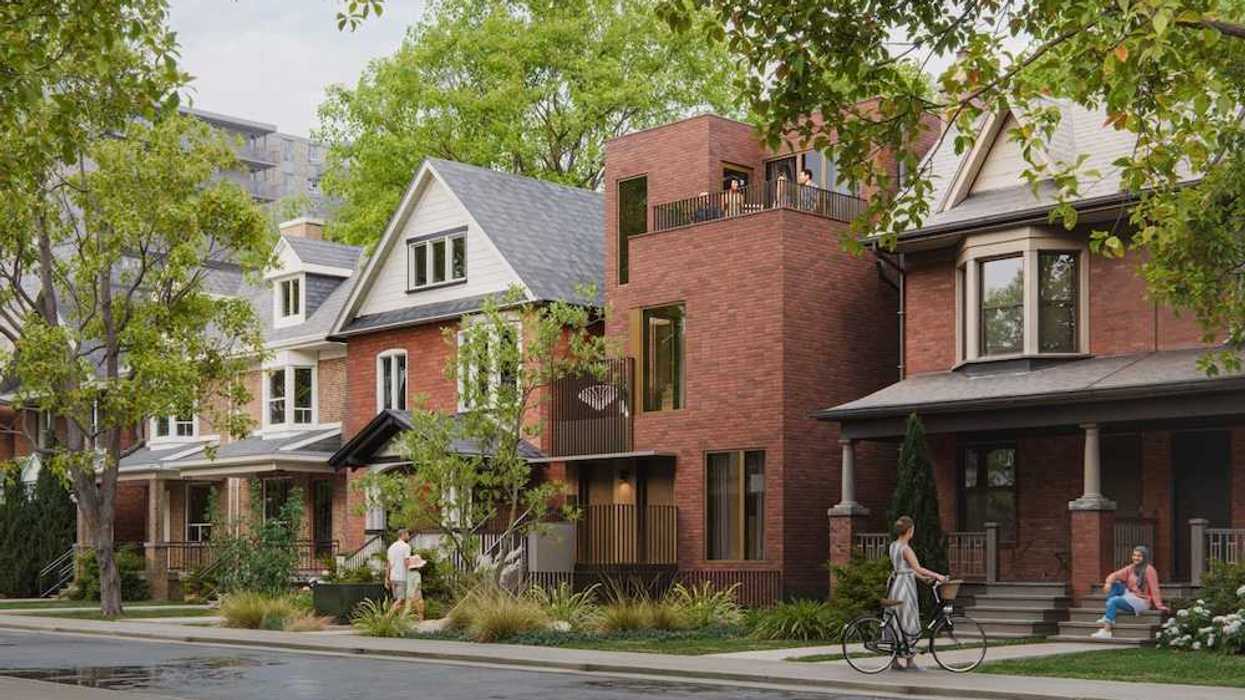
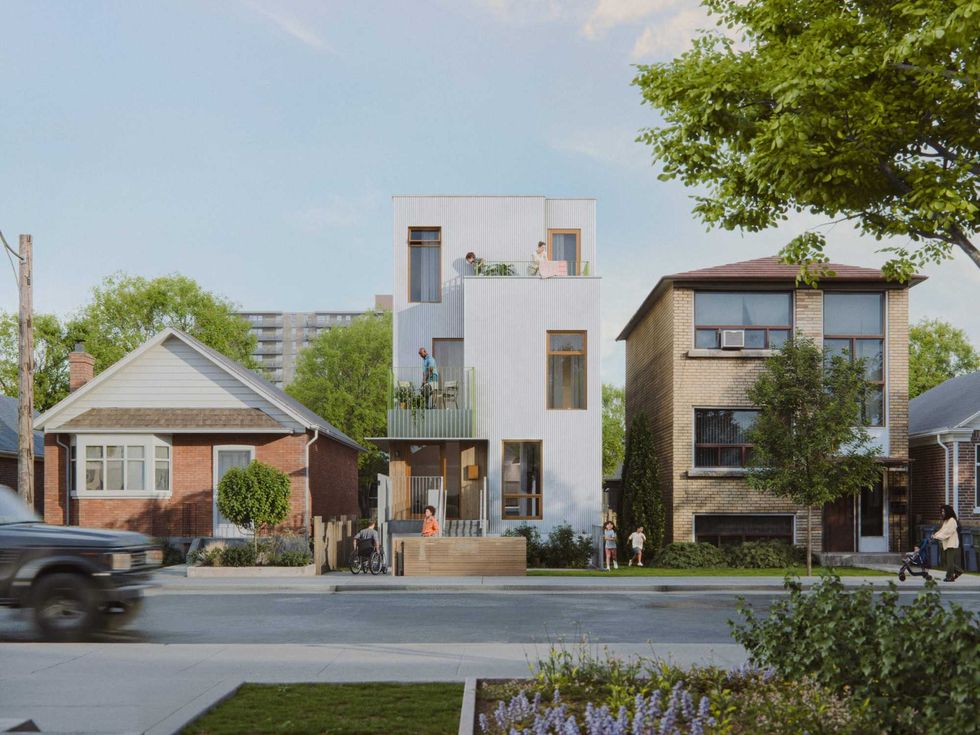 Narrow Fourplex (City of Toronto)
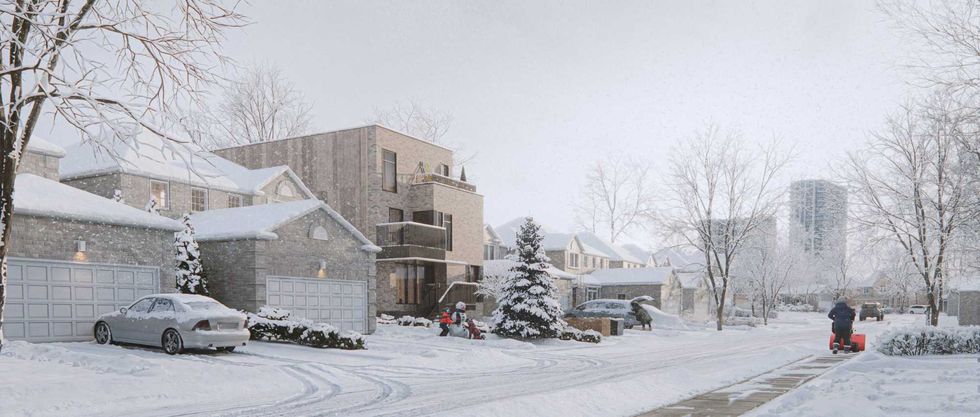 Wide Sixplex - Side View (City of Toronto)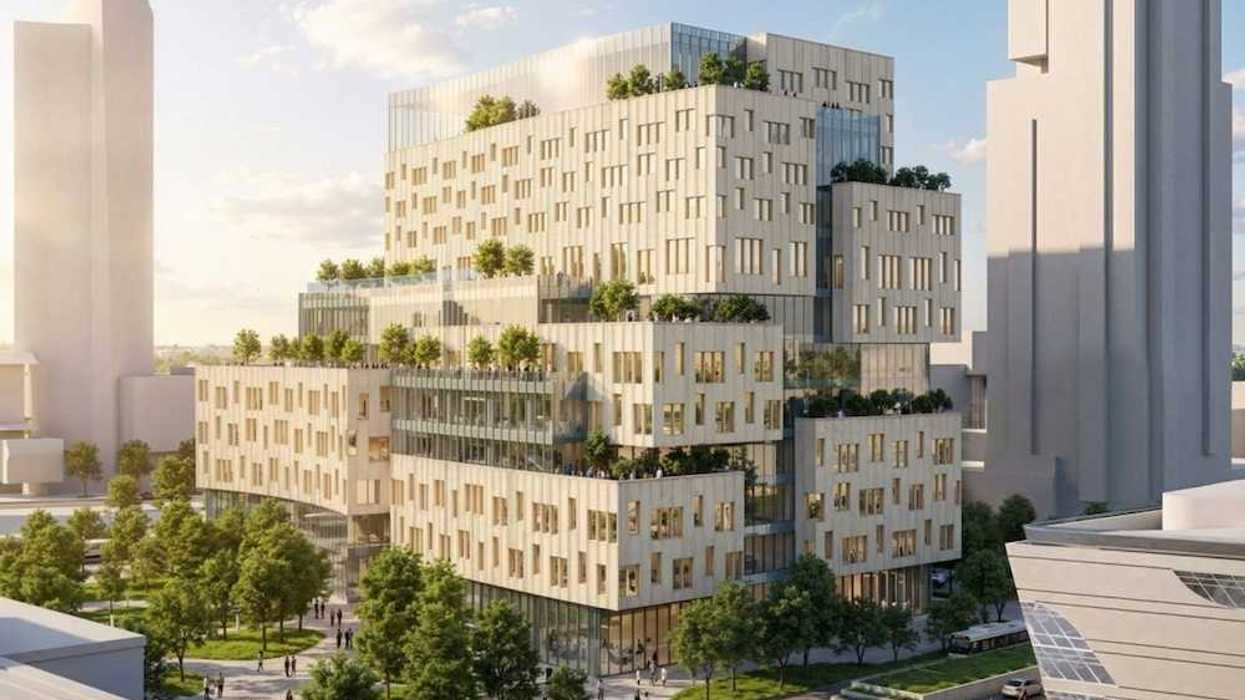
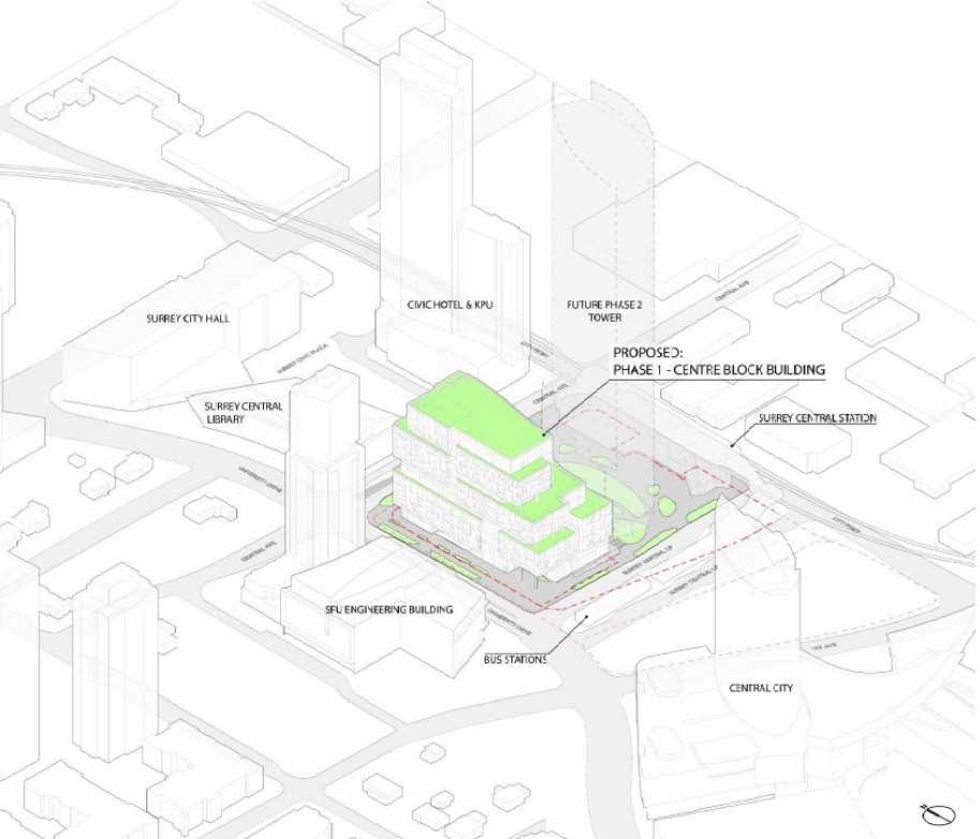 Centre Block and its surrounding context. (Stantec-Revery, SCDC)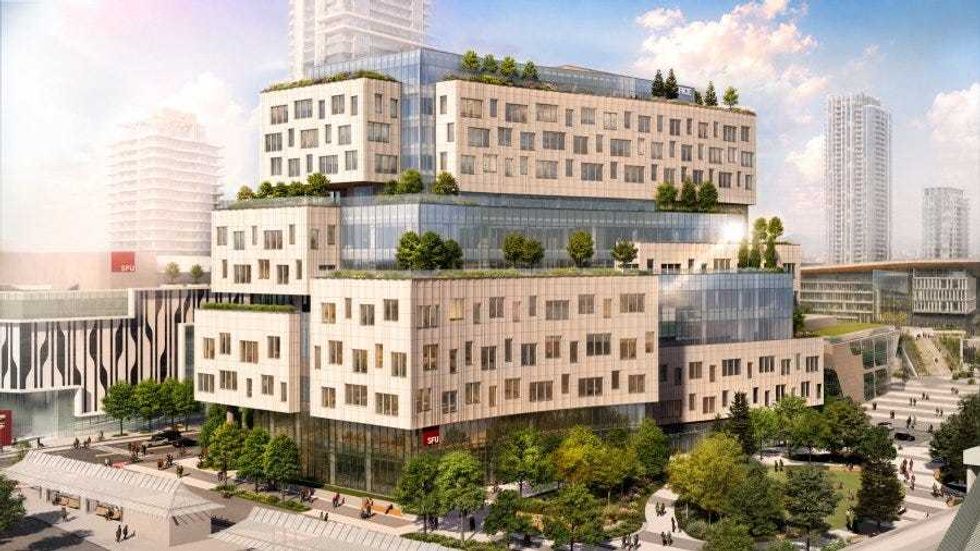
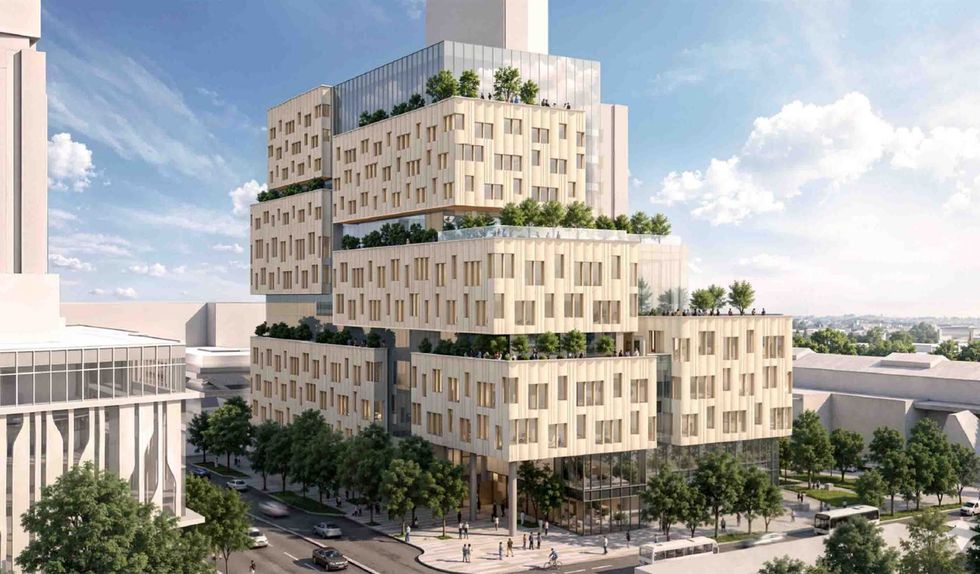 The 12-storey Phase One of Centre Block. (Stantec-Revery, SCDC)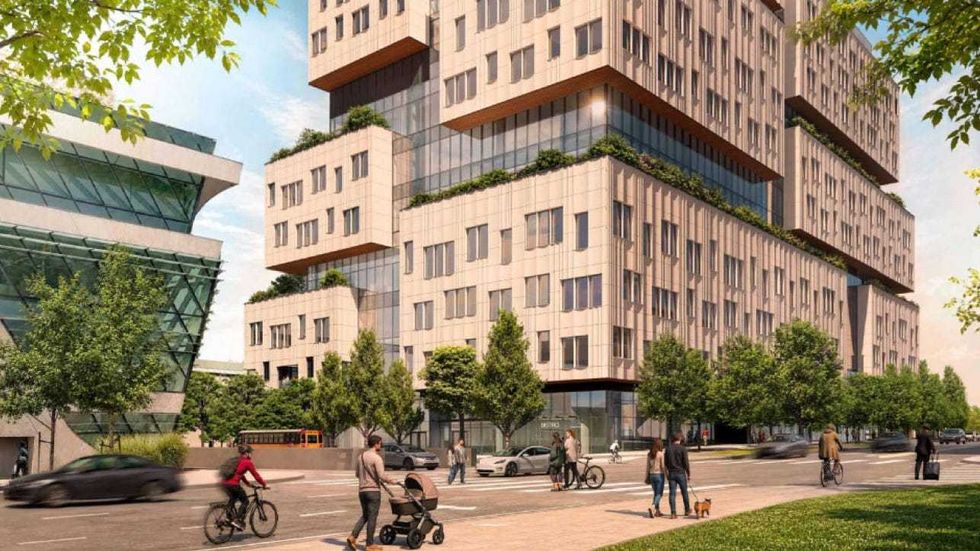
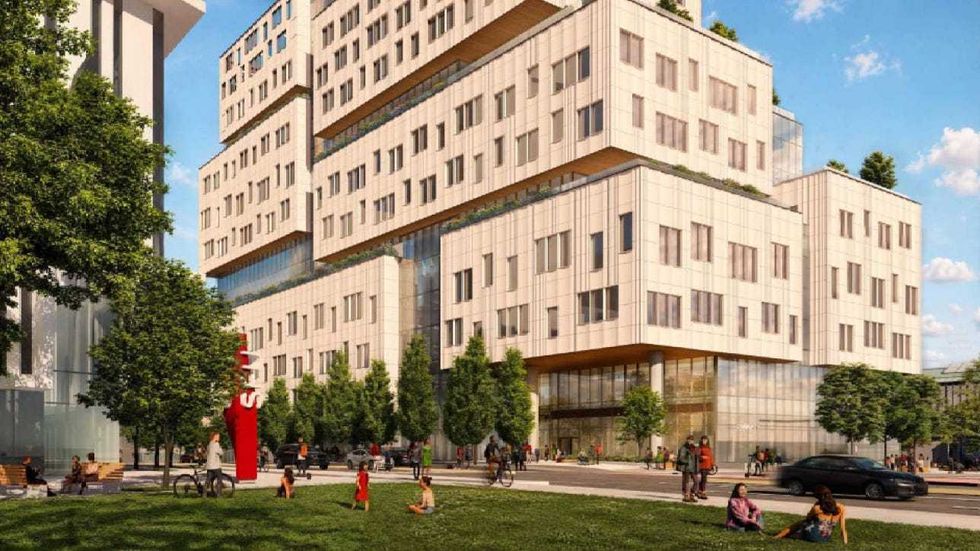 The 12-storey Phase One of Centre Block. (Stantec-Revery, SCDC)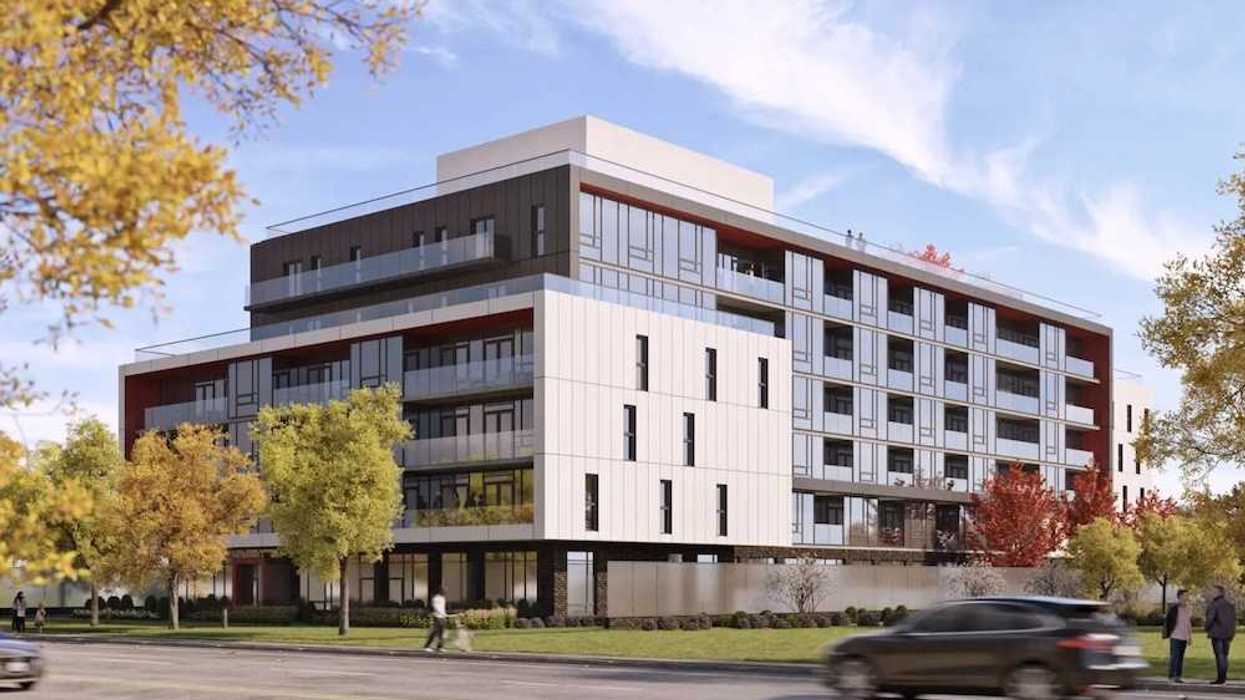
 Mondria One, set for 1607 King Street East in Clarington, Ontario. (ICON Architects Inc., Monde Development Group)