Many politicians in years past, and even some today, have pointed to speculators as a big culprit in Canada's housing affordability crisis. Two things those politicians have repeatedly pointed to are foreign buyers and flippers, with various governments introducing bans or taxes targeting them.
Last year, the federal foreign buyer ban came into effect, restricting foreign nationals from purchasing residential real estate in Canada. The policy was subsequently amended, then extended, despite there being little evidence that the ban has been a positive for housing affordability.
In 2022, the federal government also introduced an anti-flipping tax, taxing the proceeds of homes resold within one year of acquisition as business income rather than as capital gains. The British Columbian government is now set to follow suit and introduce a flipping tax of their own, which is set to come into effect on January 1, 2025.
While the former — the effect of foreign buyers — is hard to quantify, the latter — flipping activity — is much easier.
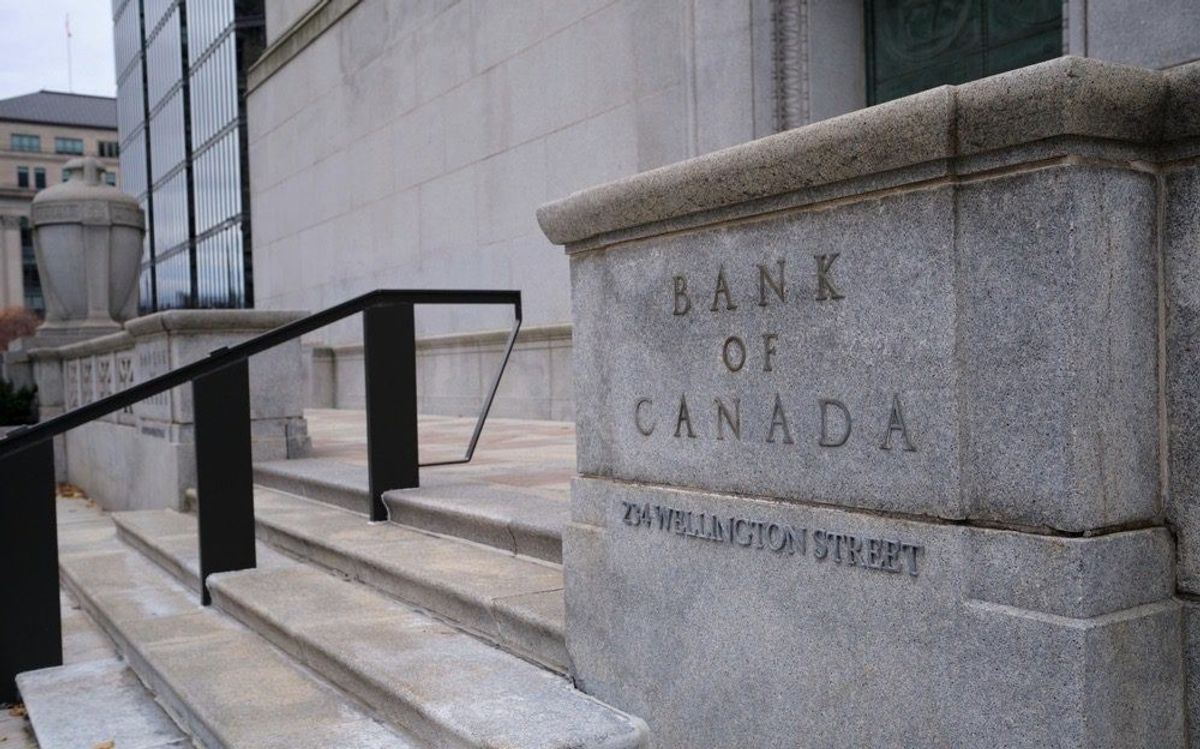
Earlier this month, the Bank of Canada published new data about flipping activity across Canada, with data pertaining to sales of homes that occurred within six months and 12 months after being acquired, across the past 10 years.
"Although a rise in house-flipping activity may improve the quality of the housing stock if renovations are involved, it may also signal that a local market is becoming increasingly influenced by speculative behaviour," said the Bank of Canada.
As the BC government has noted, however, some flipping occurs as a result of life circumstances — job changes, deaths, births — which means the true share of speculative flippers is even less than what flipping data indicates.
Here's what the numbers say for Canada, as well as some major cities across the nation.
Canada
Nation-wide, going back to Q1 2014, flips within 12 months represented just over 2.11% of all residential transactions. It then hovered around 2% until around 2016, when it spiked all the way to 2.58%, and stayed around that mark for about a year before peaking at 2.61% in Q1 2018. Since then, the share of flips saw a precipitous drop, bottoming out at 1.90% in Q3 2021.
Flipping activity then saw another steady increase, getting back up to 2.44% by Q3 2022, dropping a bit again to 2.50% in Q1 2023, before trending upwards once more and hitting 2.58% as of Q4 2023.
Flips that occurred within six months followed a very similar pattern, but represented a much lower share of residential transactions compared to flips that occurred within 12 months. This sequence is largely true for every major city.
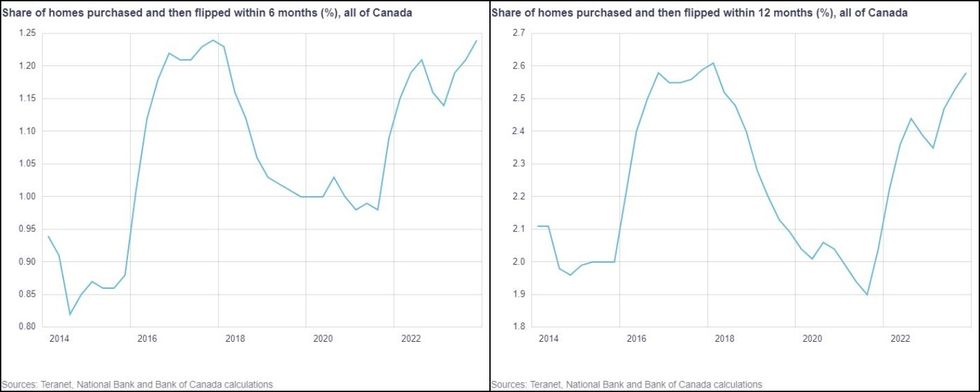 Flips within 6 months and 12 months across all of Canada.(Bank of Canada)
Toronto
Looking at national data does not tell the full story, however, as different markets can have drastically different market dynamics. For Toronto, the share of flips started this past decade at 2.30% in Q1 2014. It then dropped to 2.06% by Q4 2015, before spiking and peaking at 2.72% in Q1 2017.
Since then, flipping activity dropped steadily for four years, hitting a bottom of 1.22% in Q2 2020. It then hovered around 1.30% for a bit over a year, before increasing back up to 1.55% in Q2 2022, before returning to a steady decline since then, finishing Q4 2023 at 1.24% — just about as low as it's been in the past 10 years.
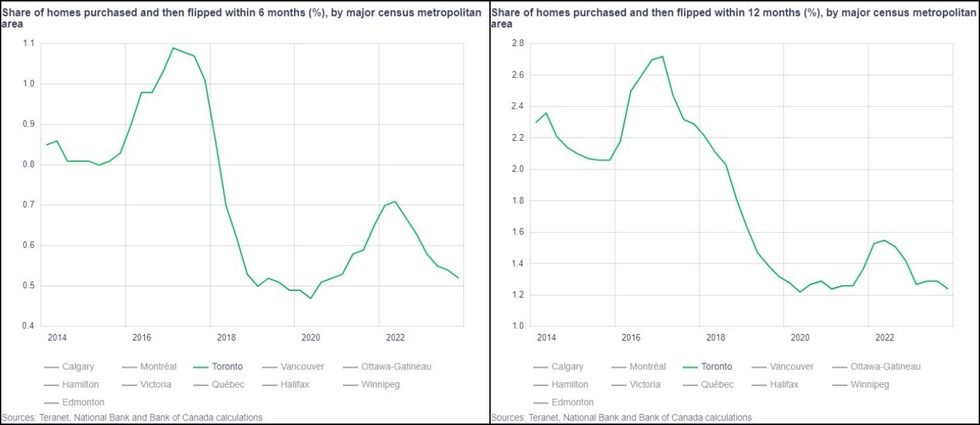 Flips within 6 months and 12 months in Toronto.(Bank of Canada)
Montreal
Illustrating the potential differences between different markets in Canada is Montreal, whose trendline is almost the inverse of that of Toronto. After starting at 1.37% in Q1 2014, flips increased to 1.45% by Q2 2015, before then bottoming out at 0.95% in Q4 2016.
Since then, however, in stark contrast to Toronto, the share of flips has steadily increased for six years, peaking at 1.88% in Q3 2022. In the year since that, however, flips are once again decreasing, finishing at 1.47% as of Q4 2023.
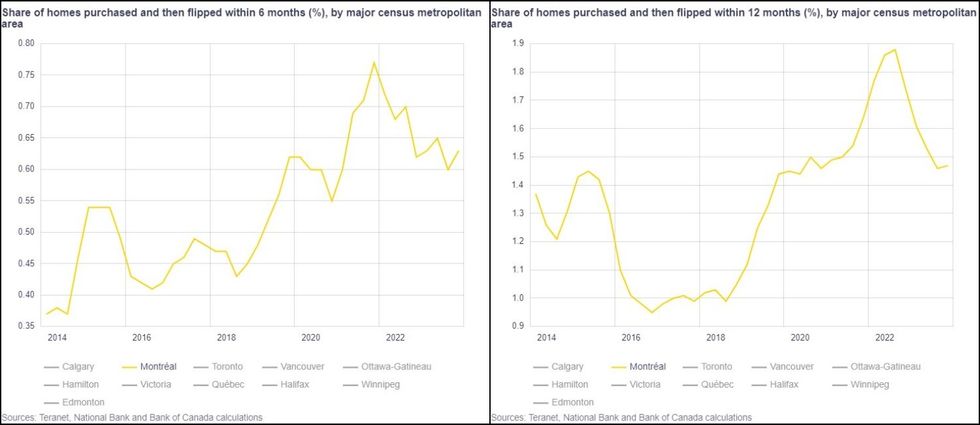 Flips within 6 months and 12 months in Montreal.(Bank of Canada)
Calgary
This may come as a surprise to some, but Calgary has led the nation in flipping activity for about eight years. After starting at 2.46% in Q1 2014 and bottoming out at 1.64% in Q4 2015, flipping activity in Calgary has increased steadily over the years, hitting 6.35% in Q4 2019 — a height that is more than double the height any other major city reached during the same period (besides Edmonton).
Flipping activity then dropped for about two years, hitting 3.24% in Q1 2022, but at that point, it was still higher than every other major city in Canada (besides Edmonton). Following that decrease, flipping activity found a second wind and has been on an upward trajectory ever since, hitting new heights in Q4 2023 at 6.54%, which ties the maximum any major city has reached in the past 10 years (Edmonton in Q1 2019).
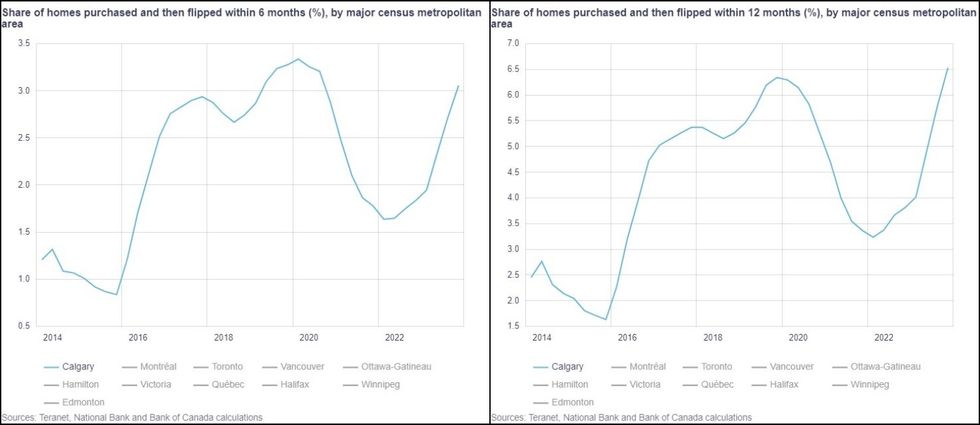 Flips within 6 months and 12 months in Calgary.(Bank of Canada)
Vancouver
The numbers for Vancouver over the past 10 years are a bit more erratic. The share of flips was at 2.74% in Q1 2024, then dropped to 2.57% in Q4 2014, before spiking all the way to 3.57% in Q2 2016. Following that peak, flipping activity saw a steep decline, bottoming out at 2.33% in Q3 2019.
Since then, the share of flips saw numerous ups and downs, before increasing dramatically from 2.41% in Q3 2012 all the way back up to 3.46% in Q4 2022. Following that second wind, however, flipping has been on a steep decline once more, finishing at 2.87% as of Q4 2023.
The idea for the new provincial flipping tax was first raised by Premier David Eby during his election campaign in Q3 2022, when flipping activity was at its highest point in six years, perhaps explaining Eby's concern. The numbers since then, however, seem to indicate that we may be on the other side of that hill.
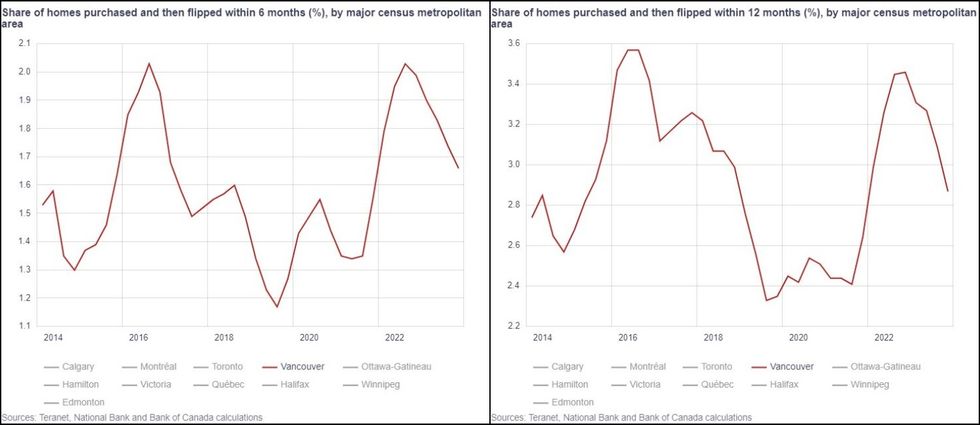 Flips within 6 months and 12 months in Vancouver.(Bank of Canada)
Toronto vs. Montreal vs. Calgary vs. Vancouver
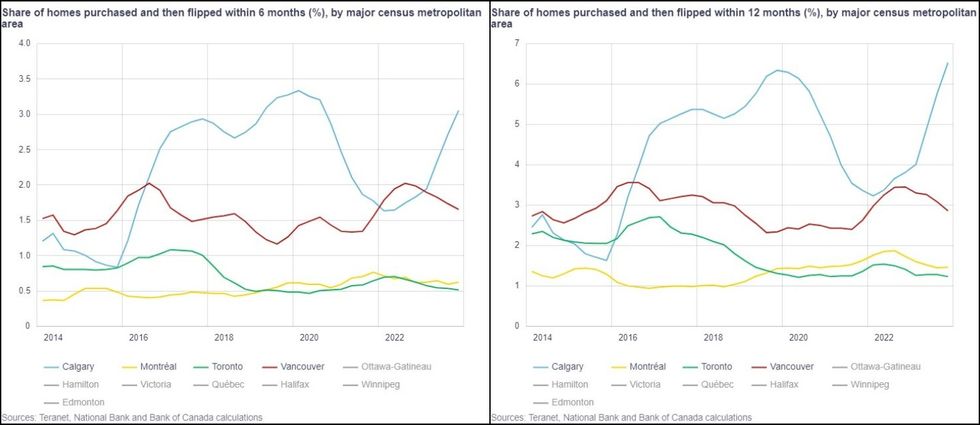 Flipping data for Toronto, Montreal, Calgary, and Vancouver side-by-side.(Bank of Canada)