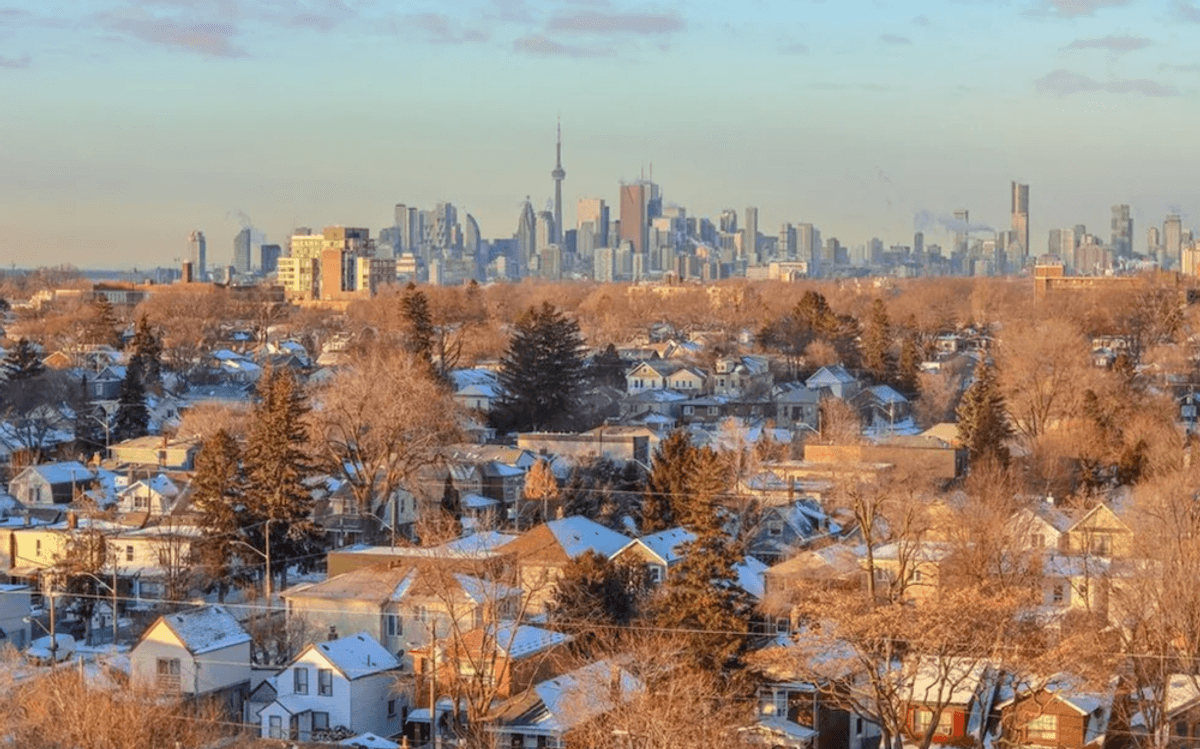
Temperatures may be dropping, but that has yet to put a freeze on late autumn real estate activity in the Greater Toronto Area – according to the latest numbers out from the Toronto Real Estate Board, home prices saw the largest increase in their pace of growth than they have all year in November, with all home types experiencing a boost.
A total of 7,090 homes traded hands over the course of the month, a robust 14.2 per cent increase year over year. The average home price increased by 7.1 per cent to $843,637, while the MLS Home Price Index – a measure of the value of homes sold – was up by 6.8 per cent. That a greater proportion of detached houses sold, which are typically among the highest-priced on the market, is partially accountable for the uptick.
READ: Here’s CMHC’s Housing Market Trend Predictions For 2020
Meanwhile, the supply and demand gap that has been plaguing the GTA continues to widen; new listings fell by 17.9 per cent, leading to increased competition among buyers and, ultimately, contributing to a greater pace of price growth.
“Strong population growth in the GTA coupled with declining negotiated mortgage rates resulted in sales accounting for a greater share of listings in November and throughout the second half of 2019,” says Jason Mercer, TREB’s chief market analyst. “Increased competition between buyers has resulted in an acceleration in price growth. Expect the rate of price growth to increase further if we see no relief on the listings supply front.”
READ: CMHC Stands By Mortgage Stress Test Despite Calls To Soften Rules
Most of GTA Now a Deep Sellers’ Market
For the GTA as a whole, the sales-to-new-listings ratio (SNLR), which is a metric that measures buyer demand, sits at 81 per cent. This is calculated by dividing the number of sales by the number of new listings over the course of the month; a ratio between 40- 60 per cent indicates a balanced market, while below and above that threshold indicate buyers’ and sellers’ markets, respectively.
It was a similar story within the City of Toronto, which experienced a 6.6 per cent increase in sales with 2,718 transactions, while new listings fell 15 per cent with 3,308. That pushed the city’s SNLR to 82 per cent, while home prices reached at average of $910,419, an increase of 8.3 per cent.
In the 905 regions, which include Burlington homes for sale and the Oshawa real estate market, sales actually increased by the greatest percentage, up by 19.5 per cent with 4,372 transactions. That’s pushed the SNLR to 81 per cent, and the average home price by 6.8 per cent to $802,120.
READ: This New Neighbourhood Is Replacing Brampton’s Shopper’s World Mall
More Home Buyers Returning to Market
Another contributing factor to tight housing supply is that there are a greater number of buyers in the market. According to TREB President Michael Collins, the impact of policies such as the Fair Housing Plan and federal stress test have been largely absorbed, as buyers now have a larger nest egg saved, have managed to qualify for a larger mortgage, or have downgraded their overall housing expectations.
“An increasing number of home buyers impacted by demand-side policies over the past three years, including the 2017 Ontario Fair Housing Plan and the OSFI mortgage stress test, have moved back into the market for ownership housing,” he says. “Based on affordability and strict mortgage qualification standards, many buyers may have likely adjusted their preferences, changing the type and / or location of home they ultimately chose to purchase.”
Check out the infographics below to see how sales and prices have increased across all home types in the 905 and 416 markets in November:
