That the housing market is finally enjoying sorely-needed supply, after months of record low inventory, has been a growing narrative over the late-winter selling season. First noticed in the second half of February, the flow of new listings has only strengthened over the course of March, offering Toronto-area buyers some relief from the red-hot conditions endured over the pandemic.
There have been some telling signs that the market is, indeed, slowing; agents have reported the re-emergence of inspection conditions and calmer offer nights -- a far cry from the frantic bidding wars sparked by peak sellers’ conditions in the past two years.
READ: Don't Look Now, But Offer Conditions Are Returning to the Market
According to the latest data from the Toronto Regional Real Estate Board (TRREB), a total of 14,147 new listings came to market in February -- still a 6.6% annual decline, but much less steep than the 15.5% drop recorded the month before. In fact, month over month, the number of new listings skyrocketed by more than 77%. Overall active inventory also improved by more than half in the short term, rebounding from a record low 4,140 homes for sale at the start of the year by 61.7%.
However, while it’s clear the market has entered a slightly less frenetic phase, looking at new listings alone doesn’t tell the whole story; the data doesn’t split out which of those fresh additions to the market are truly new supply, and which have simply been relisted with a new MLS number.
Getting the Full Picture
John Pasalis, President of Realosophy Realty, independently tracks the percentage of new low-rise listings that have been previously canceled. He tells STOREYS that as of mid-March, such listings accounted for 9% of what is available, compared to less than 5% in January. He says that while he’s noting “strong listing volume is taking some pressure out of the market,” it hasn’t led to an about-face in conditions.
“I'm still finding that the vast majority of homes still have offer nights and are still getting multiple offers -- just not as many,” he says.
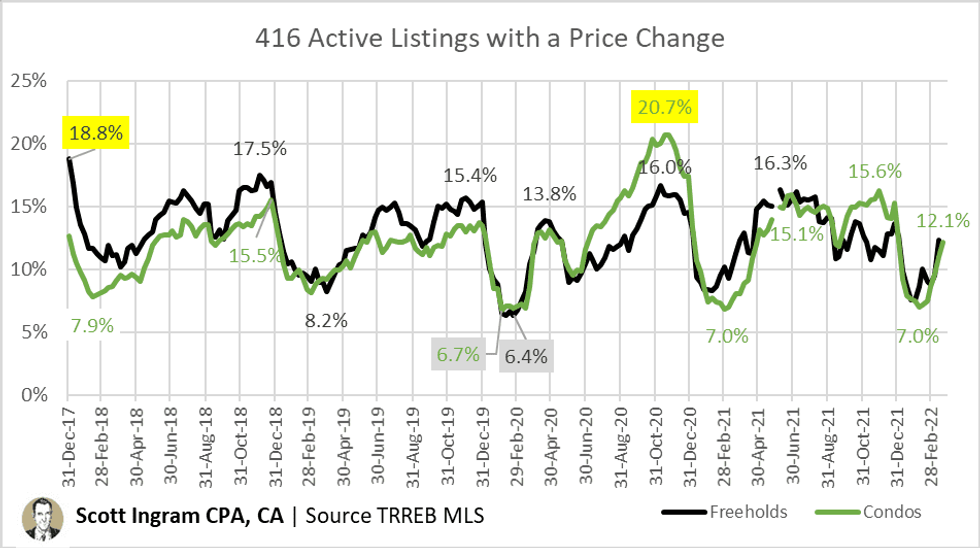
Another way to gauge trends in available inventory is to look to active listings that have had a price change since they were first listed. Toronto realtor and chartered accountant Scott Ingram says this tends to be an indicator of just how active the market is. While he points out that the GTA remains in a tight sellers’ market, the data reveals there has indeed been an uptick as of February.
 Scott Ingram/Twiiter
“If the market is more heated, things sell quickly and more easily, and don’t need a price change. It’s only when things have been lingering, or they don’t sell on the offer night that they may change the price, or terminate or relist, or if something’s been hanging around a couple of weeks,” he says.
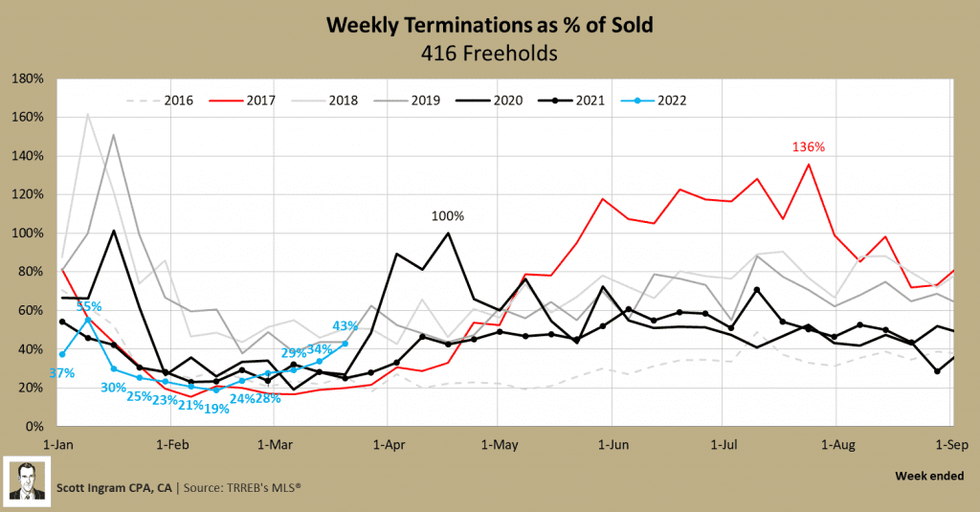
He also looks to listing terminations -- those that are removed from market entirely, rather than being paused or expiring -- as a percentage of sold homes over a period of time, which gives additional insight into what’s being left behind.
"I would say, not including the ones that sold, terminations are like 70% -- so I track terminations as a proxy for cancelled listings, because it’s the majority of it. And again, my theory is if things are selling quickly or easily -- if it sells in three days -- you don’t need to terminate it, or relist it, or do a price change.”
 Scott Ingram
Looking at the numbers, he points out that this percentage has doubled over the past five weeks for freeholds, increasing from 19% to 43% -- slightly higher than the seven-year average for the same time frame. In particular are two notable peaks over time: a spike in the winter months of 2020, when the market softened during the first COVID lockdown, and in the spring of 2017 following the introduction of the provincial Fair Housing Plan.
 Scott Ingram
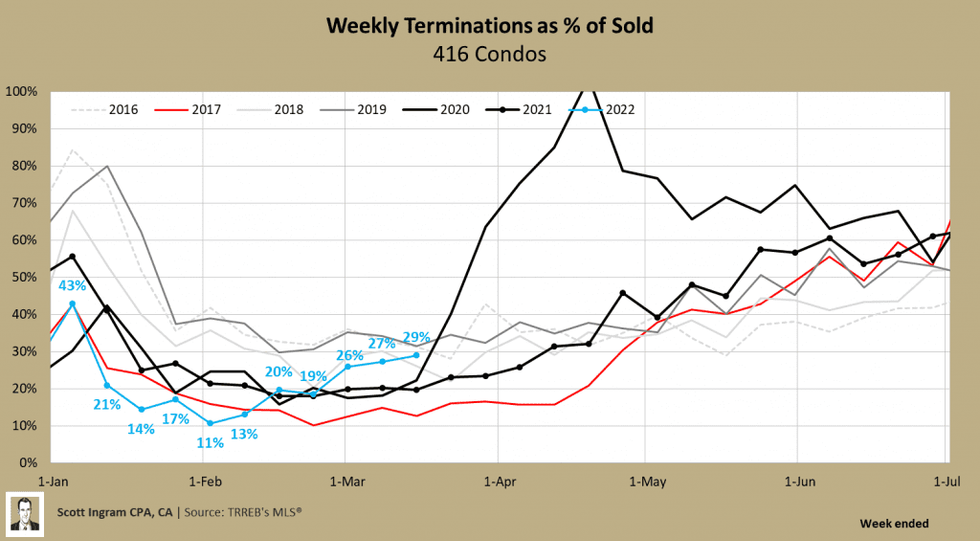
It’s a similar story for condos, he adds, though the 2020 surge is much more pronounced, reflecting the exodus from urban cores, and investors offloading their units at the onset of the pandemic.
A More Impatient Market
Overall, Ingram adds, the prominence of re-listing, or “freshening” a listing is due to how market expectations have evolved; homes today need to sell on a much shorter timeline than they previously did, or risk seeming undesirable.
“It’s weird that our market has turned to this. If you look at old-time stats for days on market, 30 to 40 days is common, but now it’s more like 15, or 10, which is partially because of the relisting thing, but partially it’s like, ‘Oh - this thing has been on the market for two weeks, what’s wrong with it?’” he says.
“I think as average days on market have gotten shorter, people have changed expectations and now that’s why you see so much of, ‘It’s been a couple of weeks, I’m going to refresh it,’ and for people who do get those daily listings, it brings it out [among] new ones, and some people would say, ‘Oh, I’ve seen this one before,’ but sometimes people will change up the front picture to make things look fresher, but when you get into it, you see that it’s the same listing.”