
Canada’s real estate industry dialled back the drama over the summer months on the home sales front.
Statistics released today by the Canadian Real Estate Association (CREA) show Canada’s home sales changed very little between July and August 2021.
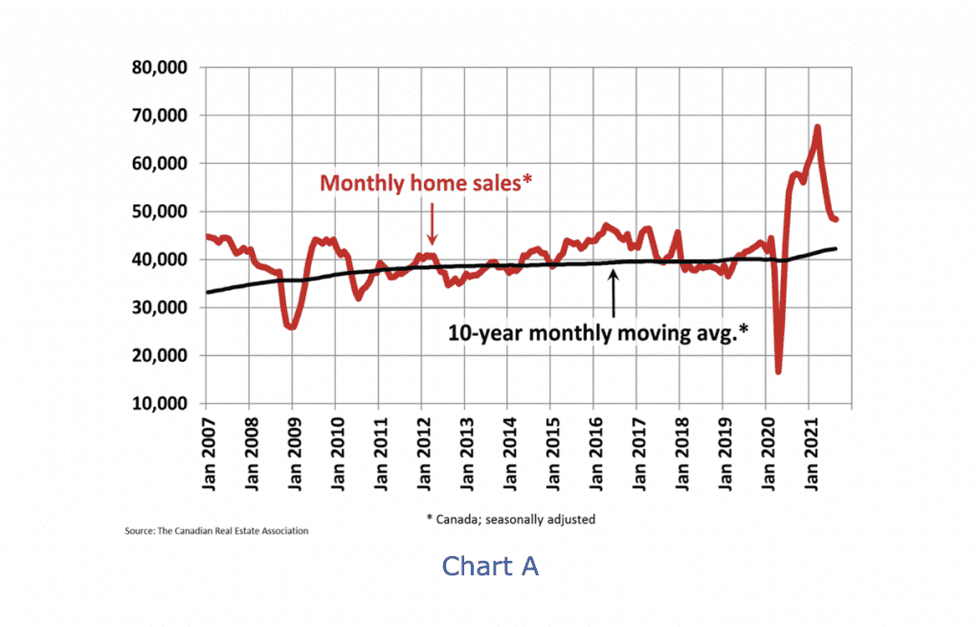
The figures reveal that home sales recorded over Canadian MLS® Systems edged back a slight 0.5% on a month-over month basis in August 2021, as transactions appear to be stabilizing at more sustainable -- but still historically active -- levels.
According to CREA, it was fairly even split between the number of local markets where home sales were up and those where they were down, and without any commotion anywhere. Small declines in the Greater Toronto Area (GTA) and Montreal were offset by gains in the Fraser Valley, Quebec City, and Edmonton, reported the association.
Continuing a departure from the flurry of activity experienced earlier in the year, the actual (not seasonally adjusted) number of transactions in August 2021 was down 14% on a year-over-year basis from the record set for that month last August. That said, it was still the second-best month of August in history.
So, clearly, there are no signs that the market will continue to cool to attainable levels, despite the wishful thinking of would-be homebuyers.
“Ideas on how to fix the housing market have taken centre stage in this election, with many long-simmering issues having had a big spotlight shone on them over the last year-and-a-half by COVID,” said Cliff Stevenson, Chair of CREA.
"The numbers for August provided more evidence of what many of us already knew or suspected to be the case –this housing crisis will not go away on its own. As such, it’s encouraging to see all of the major parties looking at longer-term solutions to an issue that’s been around for a while. It also highlights how there are no quick fixes here, so this market will remain challenging for those who choose or have to engage in it. That’s why your best bet is to consult with your local REALTOR® for information and guidance about buying or selling a home in these unprecedented times,” continued Stevenson.
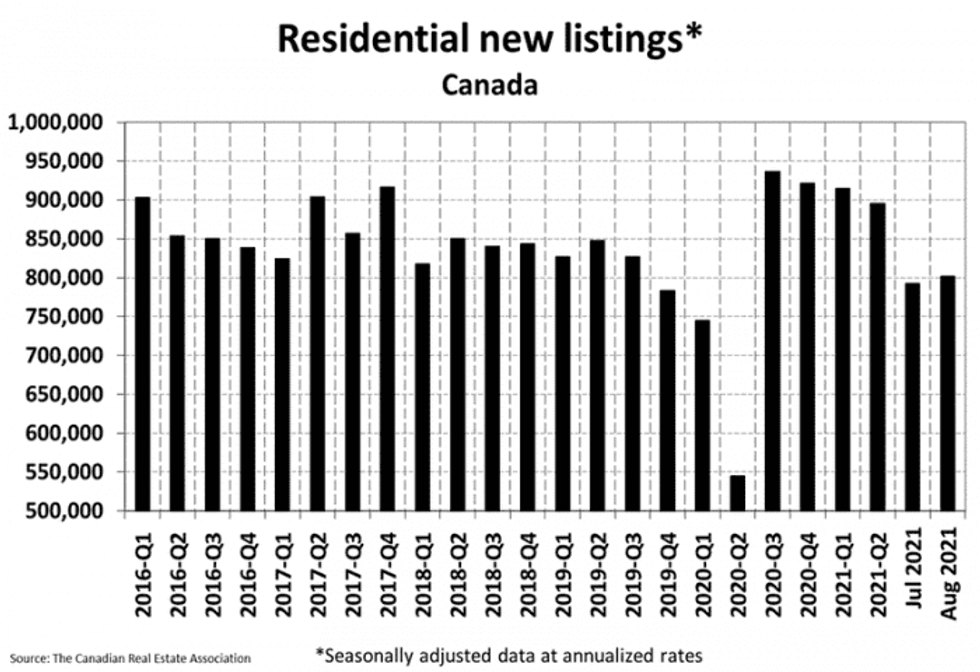
The number of newly listed homes ticked 1.2% higher in August compared to July. As with home sales activity, it was a fairly even split between markets that saw declines and those that saw gains. Among bigger Canadian markets, new supply declines in the GTA and Ottawa were offset by gains in Vancouver and Montreal.
With both sales and new listings relatively unchanged in August, the sales-to-new listings ratio remained a tight 72.4% compared to 73.6% in July. The long-term average for the national sales-to-new listings ratio is 54.7%.
According to the report, based on a comparison of sales-to-new listings ratio with long-term averages, a small majority of local markets remain in seller’s market territory, with the remainder in balanced territory.
There were 2.2 months of inventory on a national basis at the end of August 2021, down slightly from 2.3 months in July. This is extremely low -- still indicative of a strong seller’s market at the national level and in most local markets, says CREA. The long-term average for this measure is more than twice where it stands today. It was also the first time since March that this measure of market balance tightened up.
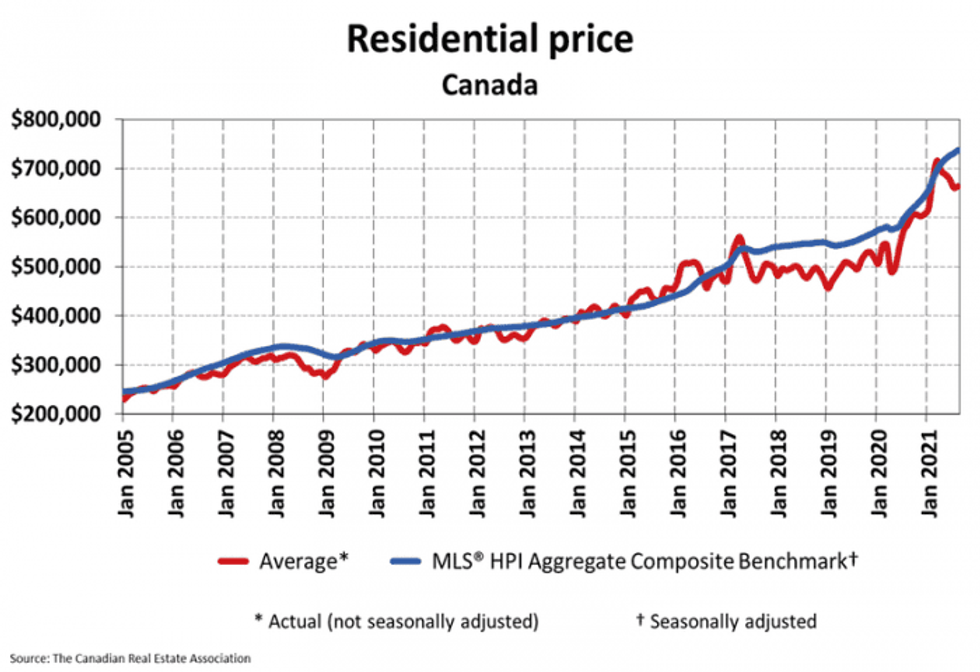
The Aggregate Composite MLS® Home Price Index (MLS® HPI) rose 0.9% month-over-month in August 2021. In line with tighter market conditions, this was the first acceleration in month-over-month price growth since February, says CREA.
“While the trend of re-accelerating prices was first observed earlier this summer in Ontario, the reversal at the national level in August was less of a regional story and more of a critical mass story,” reads the report. “Synchronous trends across the country have been the defining feature of the housing story since COVID-19 first hit, and that still appears to be the case.” The non-seasonally adjusted Aggregate Composite MLS® HPI was up 21.3% on a year-over-year basis in August.
Throughout the country, we are seeing year-over-year price growth, especially in the notoriously pricey provinces of Ontario and BC. In Ontario, price growth is still over 20%, with gains notably lower in the GTA, hovering around the provincial average in OakvilleMilton, Hamilton-Burlington and Ottawa, and considerably higher in most smaller markets in the province.
As in Ontario, BC saw most of its price growth in smaller urban areas. In BC, price growth averaged around 20%, but was lower in Vancouver, slightly lower in Victoria, and higher in other parts of the province. Meanwhile, in Quebec, the opposite trend of Ontario and BC is taking shape; Greater Montreal’s year-over-year price growth, at a little over 20%, is almost double that of Quebec City.
Year-over-year price gains are in the mid-to-high single digits in Alberta and Saskatchewan, while gains were a little over 10% in Manitoba. Meanwhile, New Brunswick has experienced the nation’s highest price growth, running at a little above 30% (higher in Greater Moncton, a little lower in Fredericton and Saint John). A little further east, Newfoundland and Labrador is in the 10% range on a year-over-year basis (a bit lower in St. John’s).
The actual (not seasonally adjusted) national average home price was $663,500 in August 2021, up 13.3% from the same month last year. Naturally, the national average price is heavily influenced by sales in the GTA and Greater Vancouver. In fact, home prices in Toronto are more than double those in the still relatively attainable Calgary. Excluding these two markets from the calculation in August 2021 cuts over $130,000 from the national average price.