Lot Coverage Ratio
Lot coverage ratio is a zoning control that limits the percentage of a lot covered by structures, affecting development potential and neighborhood density.
September 30, 2025
What is Lot Coverage Ratio?
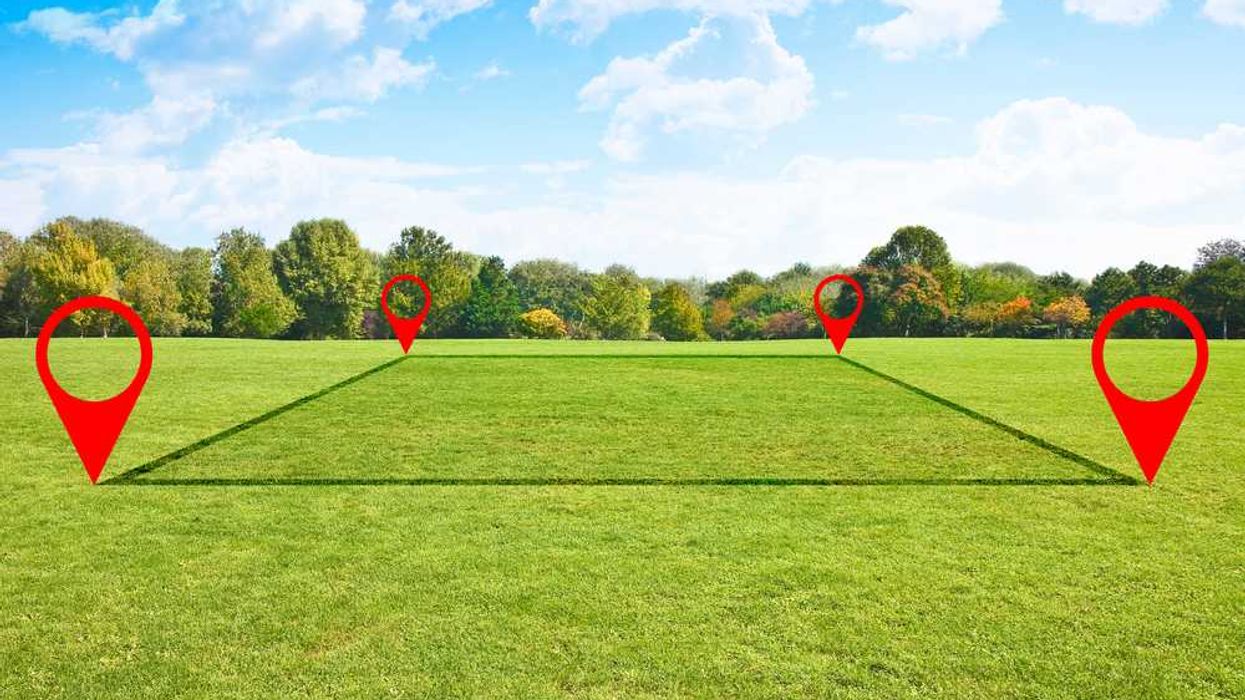
Lot coverage ratio is a zoning metric that represents the percentage of a property’s total lot area that can be covered by buildings or structures. It is calculated by dividing the building footprint area by the total lot area. This metric excludes driveways, patios, and landscaping, but includes garages, sheds, and other permanent structures.
Why Lot Coverage Ratio Matters in Real Estate
Lot coverage ratio matters in real estate because it directly impacts the intensity of land use, development potential, and neighborhood character. Municipalities use this ratio to manage density, ensure adequate green space, and prevent overbuilding. For buyers and developers, understanding the ratio is key to determining what can be built or expanded on a property.
Example of Lot Coverage Ratio in Action
A property with a 10,000 sq. ft. lot has a maximum lot coverage ratio of 35%. This means the total building footprint cannot exceed 3,500 sq. ft., limiting the size of the home and any accessory structures.
Key Takeaways
- Lot coverage ratio controls the percentage of land covered by structures.
- Used by municipalities to regulate density and maintain neighborhood character.
- Impacts property expansion and redevelopment potential.
- Buyers and developers must review local bylaws for compliance.
- Helps preserve green space and reduce stormwater impacts.
Related Terms
- Floor Area Ratio (FAR)
- Setback
- Zoning Bylaw
- Density Study
- Building Permit

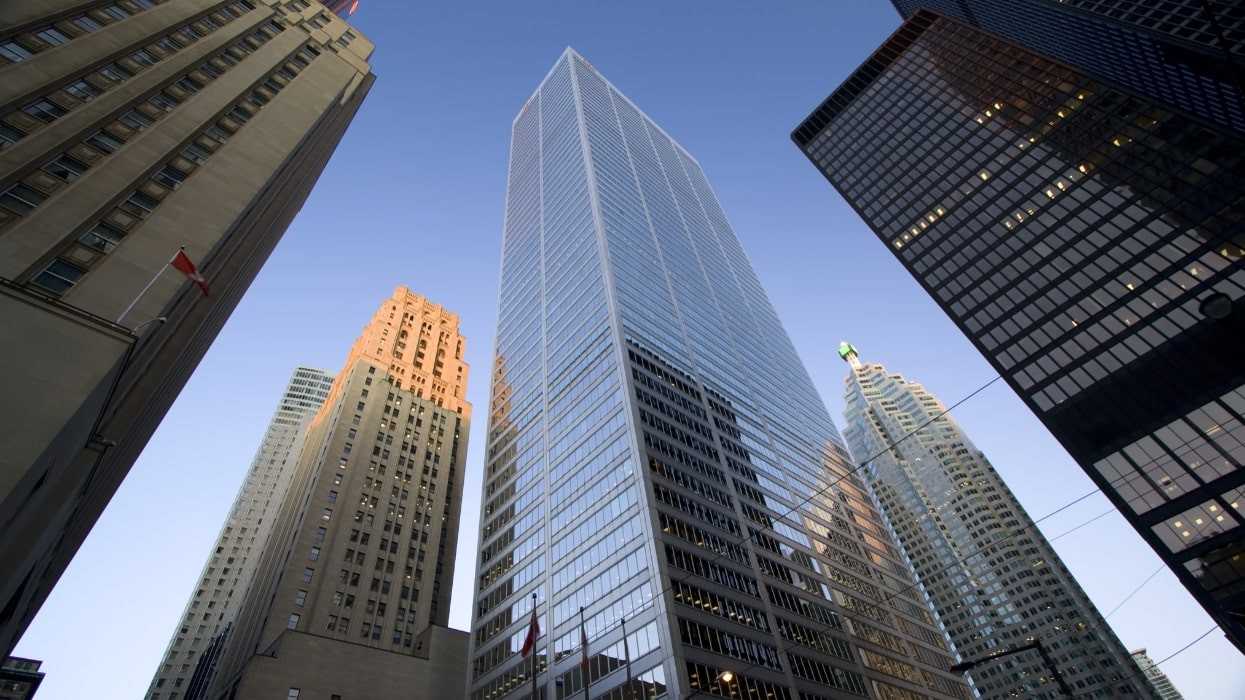
 (Avison Young)



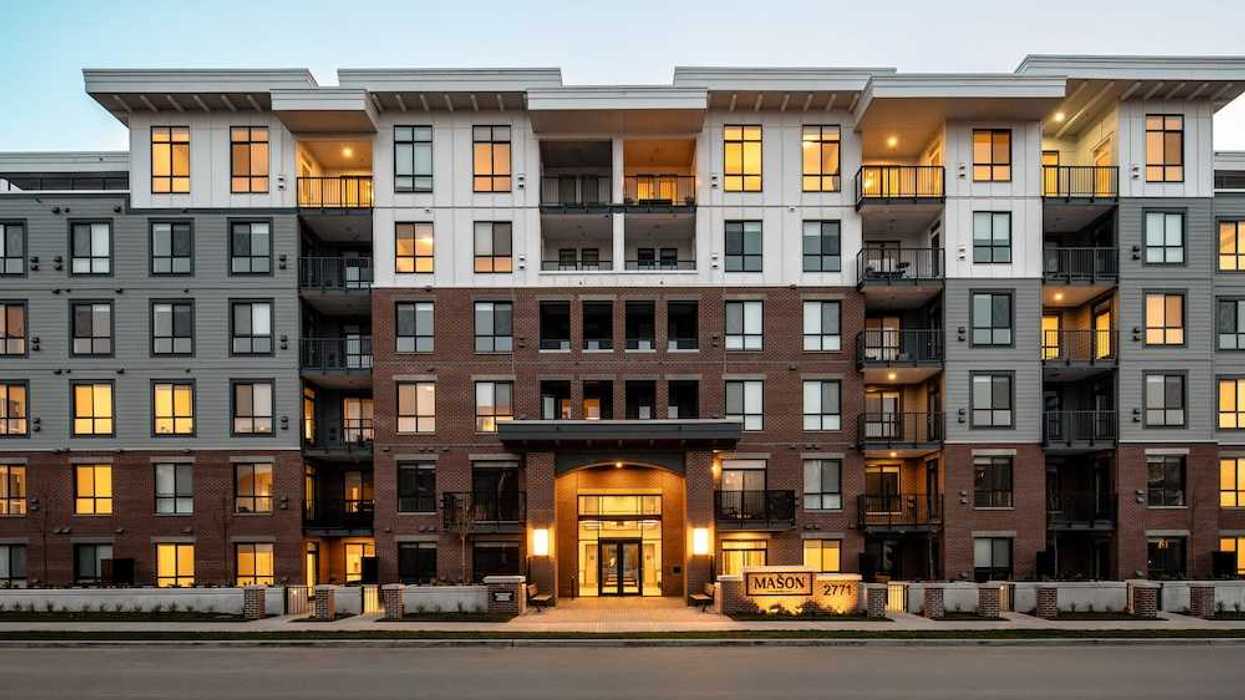
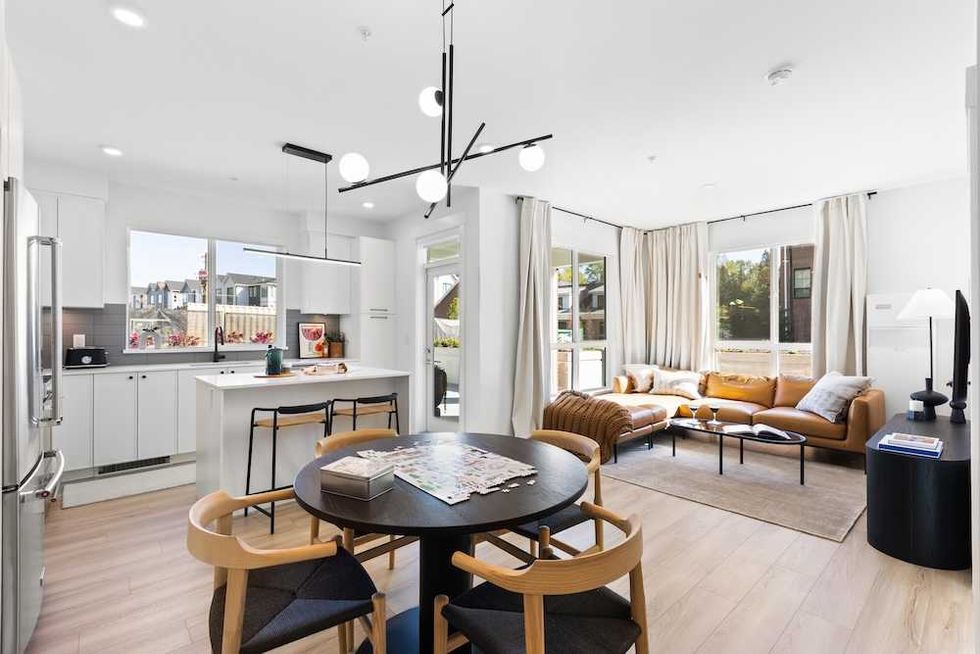 The Mason Suite Interior (Infinity Properties)
 The Mason Suite Interior (Infinity Properties)
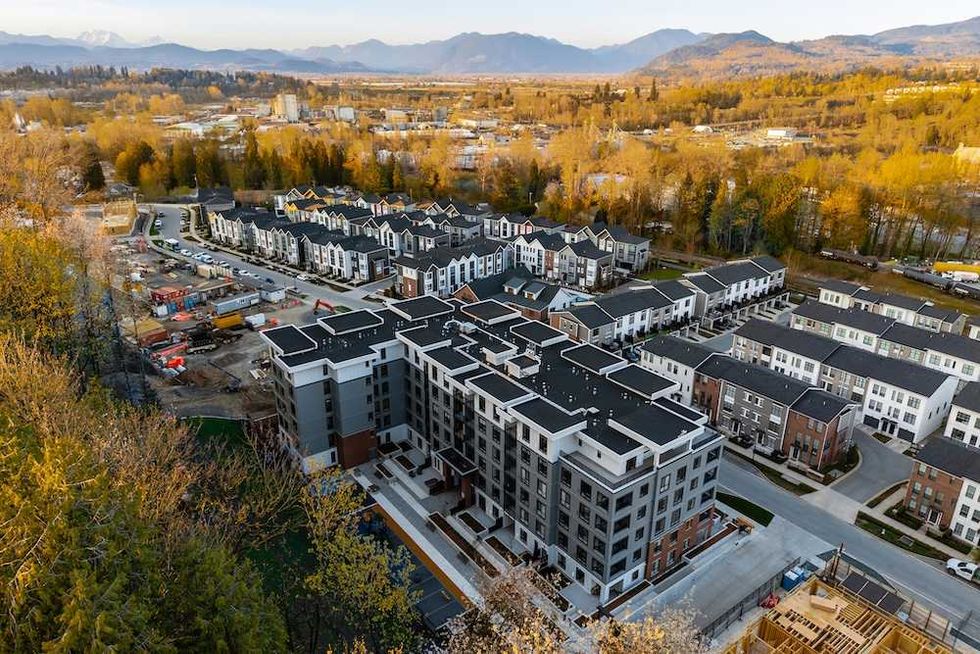 Rail District aerial (Infinity Properties)
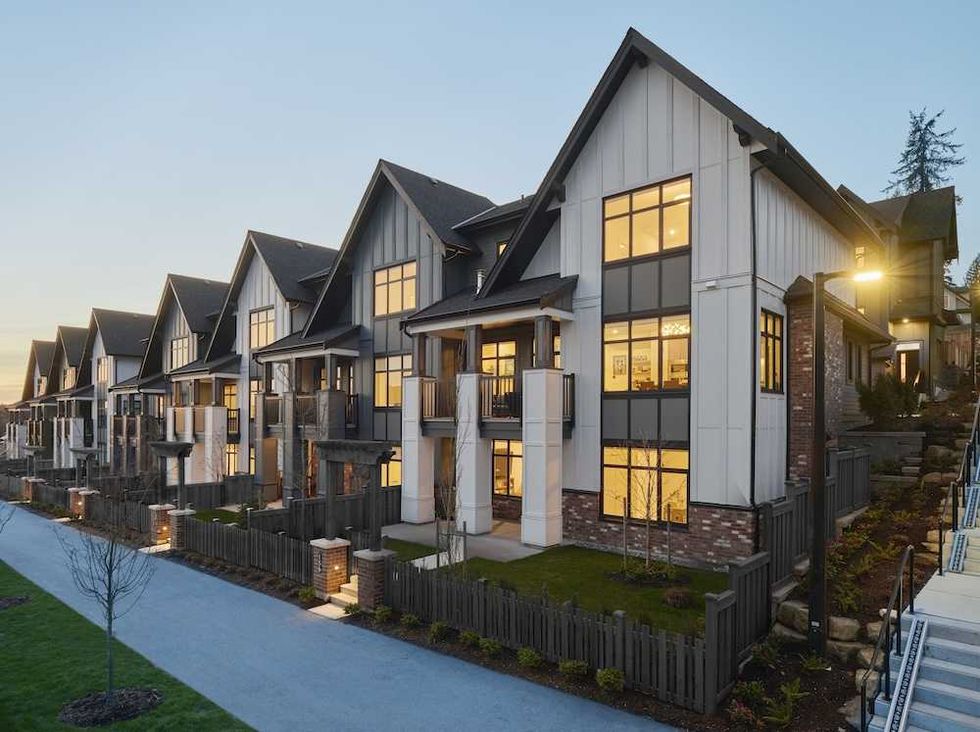 Versant (Infinity Properties)

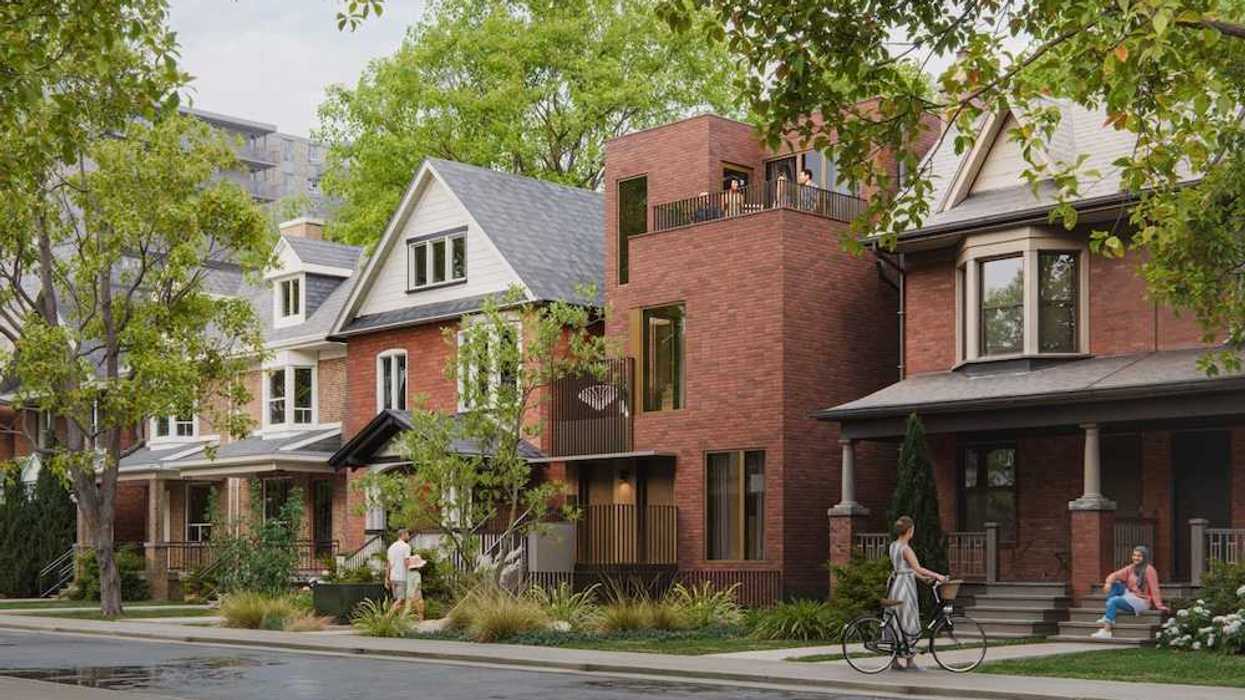
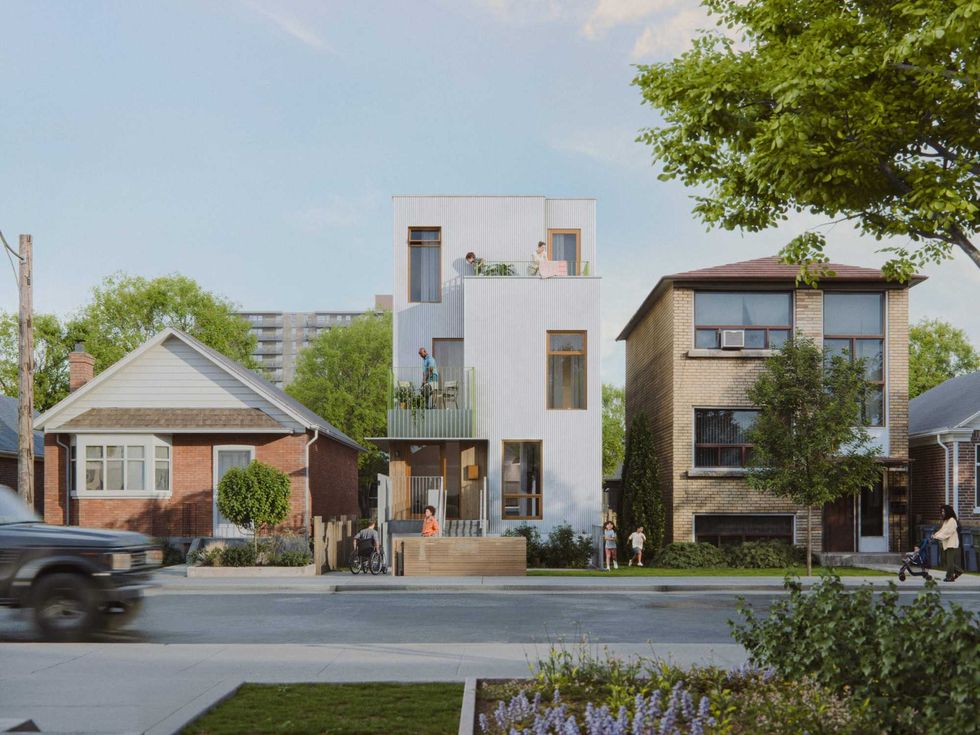 Narrow Fourplex (City of Toronto)
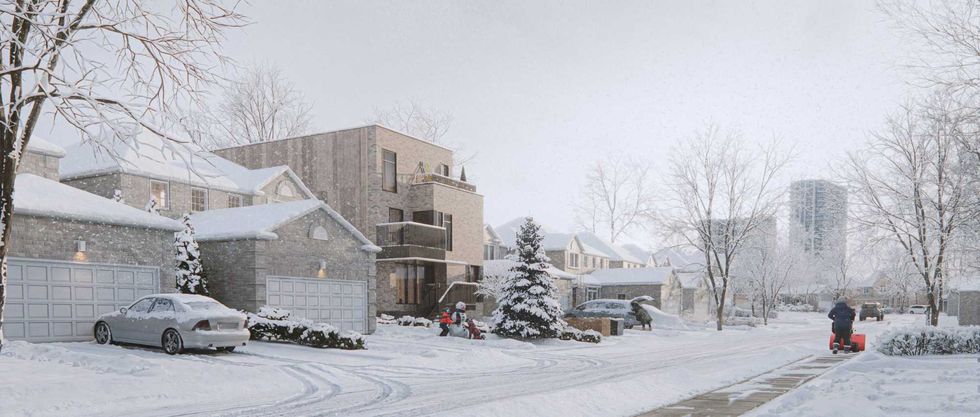 Wide Sixplex - Side View (City of Toronto)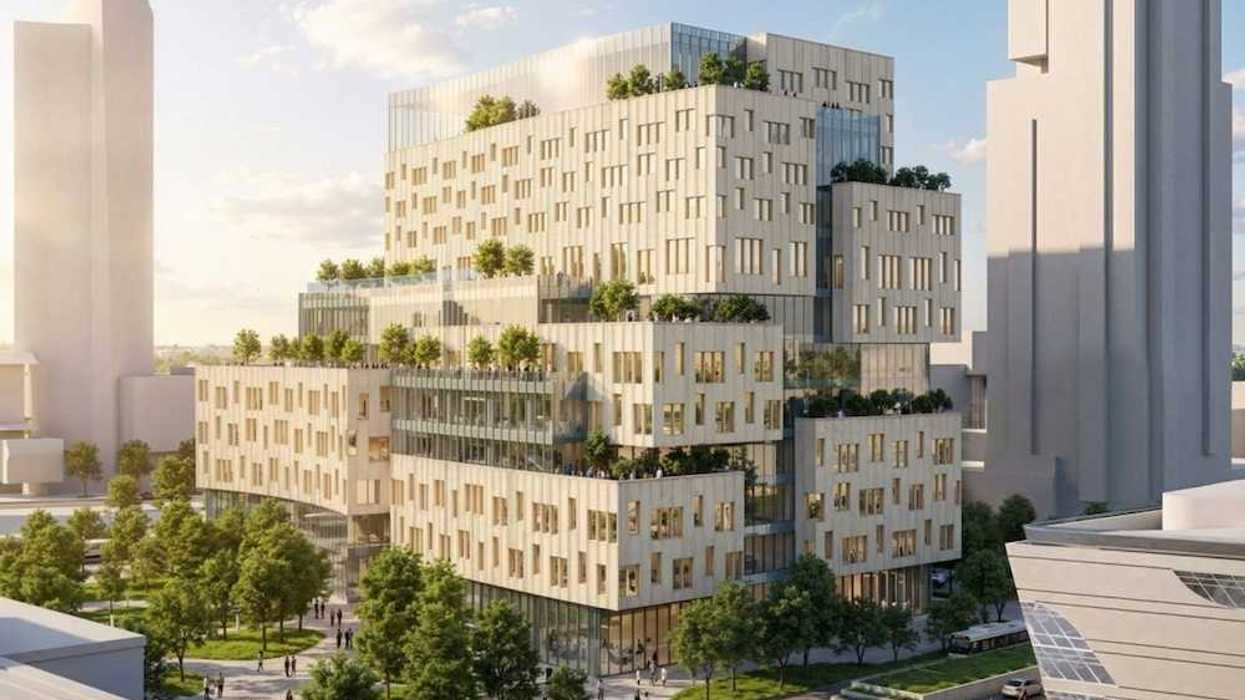
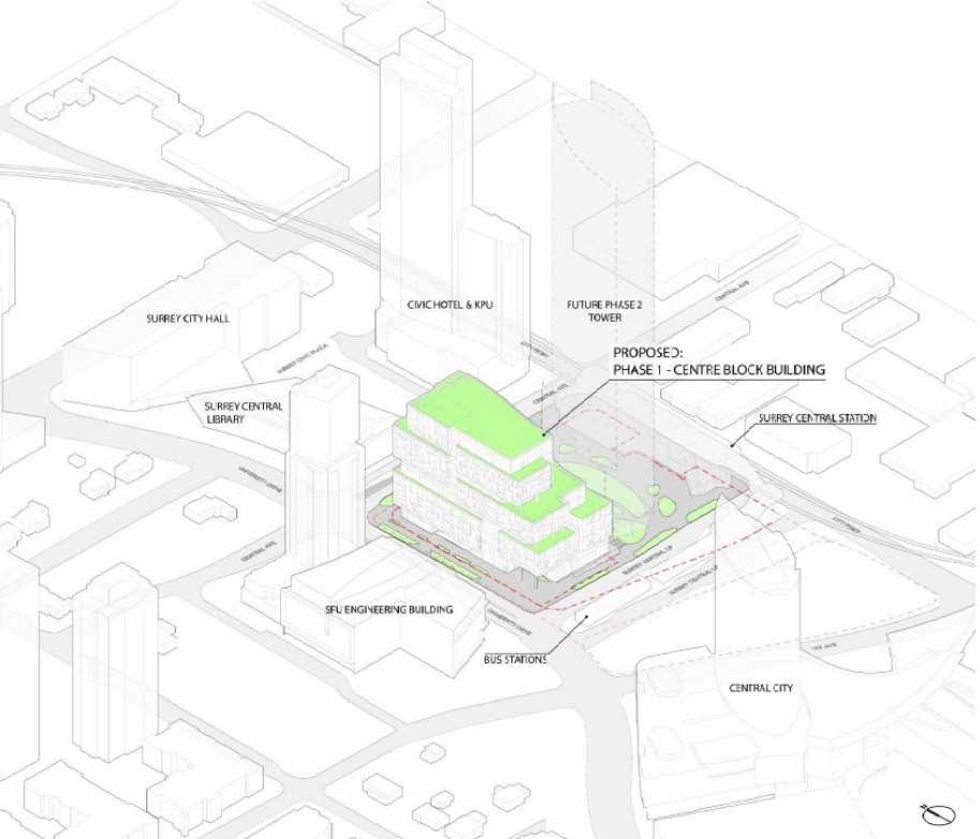 Centre Block and its surrounding context. (Stantec-Revery, SCDC)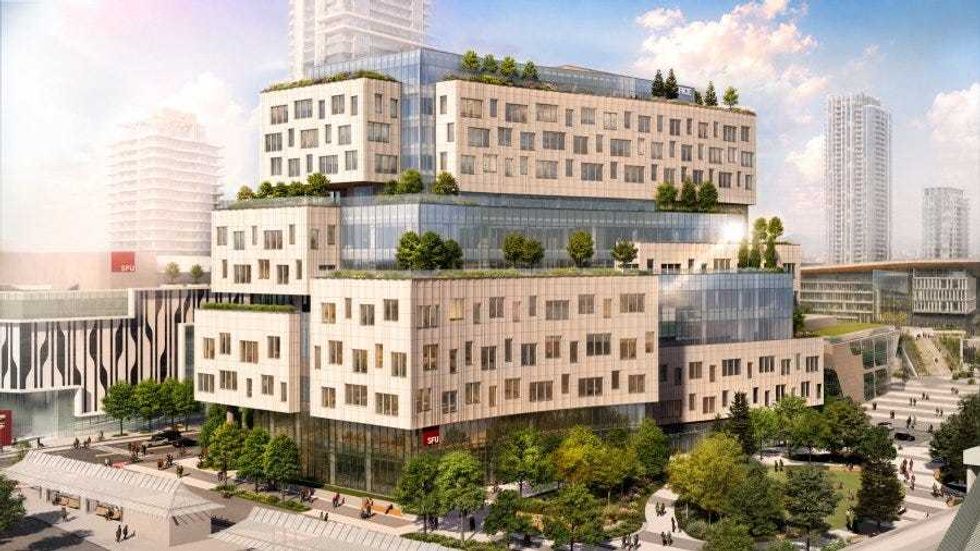
 The 12-storey Phase One of Centre Block. (Stantec-Revery, SCDC)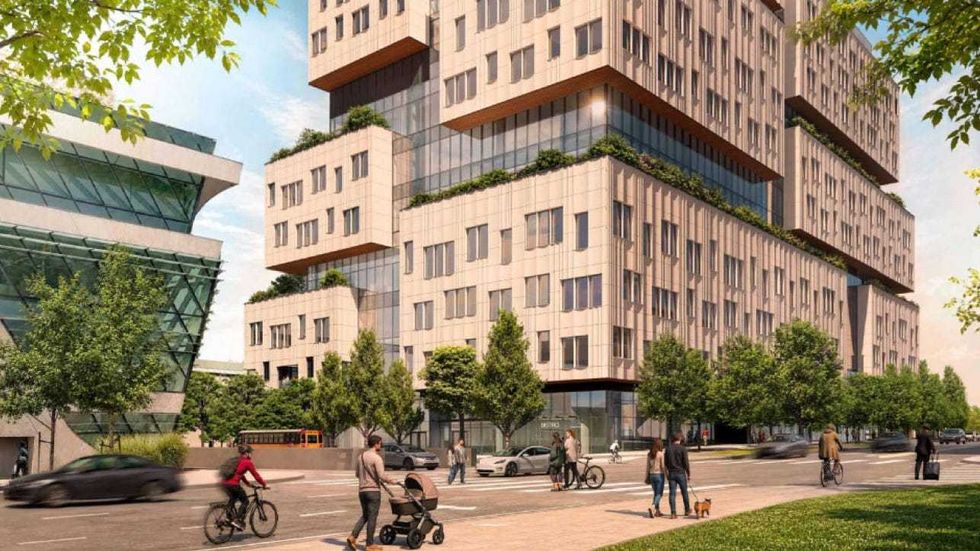
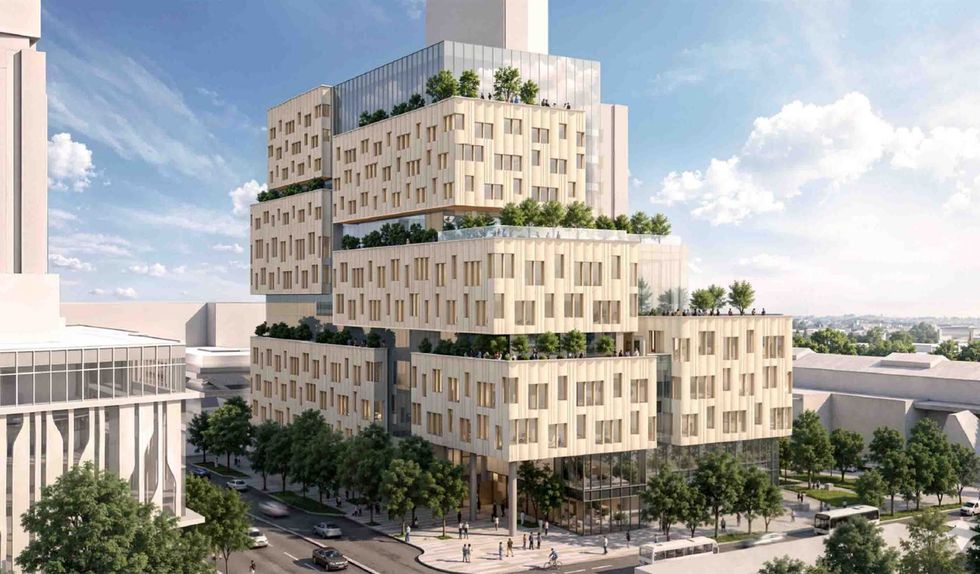
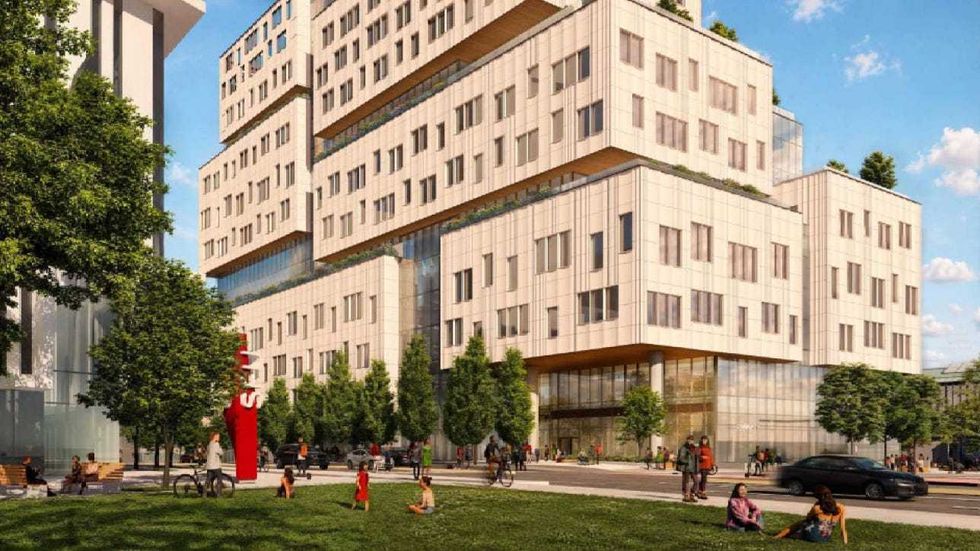 The 12-storey Phase One of Centre Block. (Stantec-Revery, SCDC)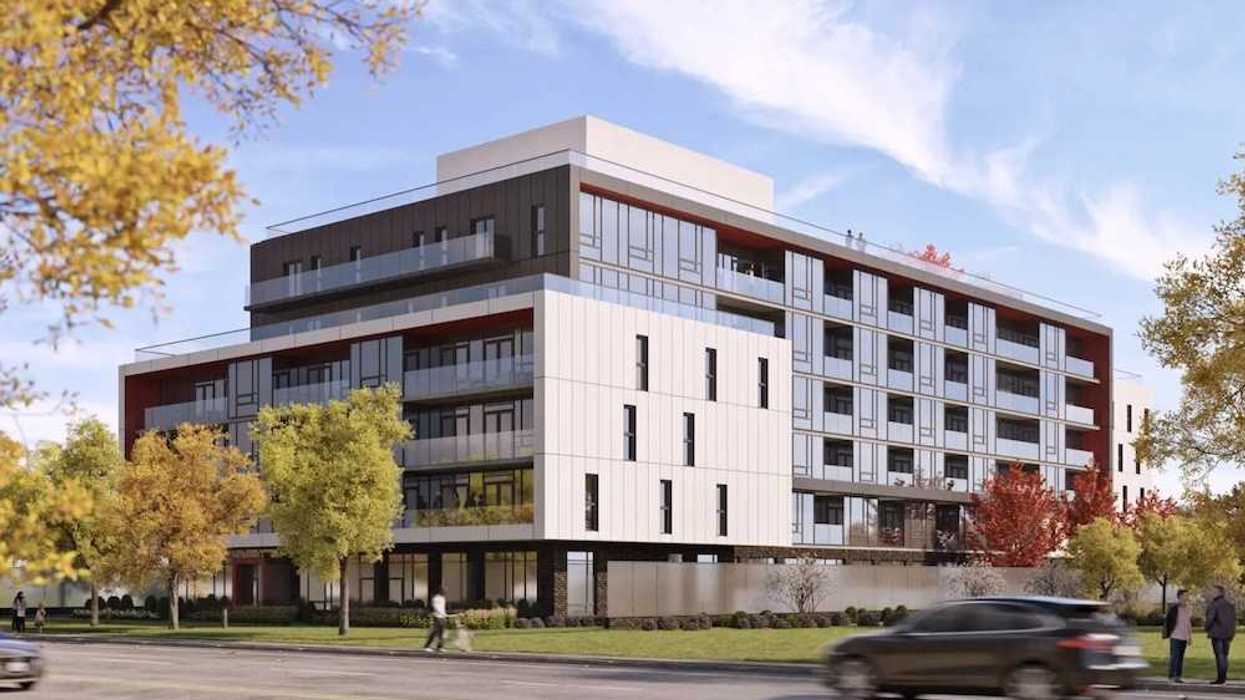
 Mondria One, set for 1607 King Street East in Clarington, Ontario. (ICON Architects Inc., Monde Development Group)