It's starting to feel like summer, both in terms of the weather and the climate of the Metro Vancouver housing market, according to the latest statistics published by the Real Estate Board of Greater Vancouver on Friday.
In May, Metro Vancouver recorded 3,381 residential home sales, up from the 2,721 sold in April and the 2,511 sold in March. The May total represents a 14.7% improvement compared to the 2,947 home sales recorded in May 2022, and just slightly below the 10-year average of 3,458.
May also saw 5,661 new listings, which is an improvement from the 4,307 new listings recorded in April, but a 11.5% decrease compared to the 6,397 recorded in May 2022, as well as 4.3% below the 10-year average of 5,917.
At the end of May, the total number of active listings is now up to 8,809, again a decrease compared to the this time last year (10,382) and below the 10-year average of 11,705.
The Market Lean
What do these numbers tell us, and what do they mean for buyers and sellers?
With the above statistics, we can calculate the sales-to-new-listings ratio and the sales-to-active-listings ratio, which are two quantitative indicators that can help us identify whether the housing market in Metro Vancouver is favouring buyers or sellers.
For the sales-to-new-listings ratio, a ratio of 40% or lower is considered to be favouring buyers, a ratio of 55% or higher is considered to be favouring sellers, and anything in between is considered a balanced market.
With 3,381 home sales and 5,661 new listings recorded in May, the sales-to-new-listings ratio is now at 59.7%, an indicator that we may be in a sellers' market.
For the sales-to-active-listings-ratio, a ratio of 12% or lower is viewed as favouring buyers, a ratio of 20% or higher is viewed as favouring sellers, and anything in between is viewed as a balanced market.
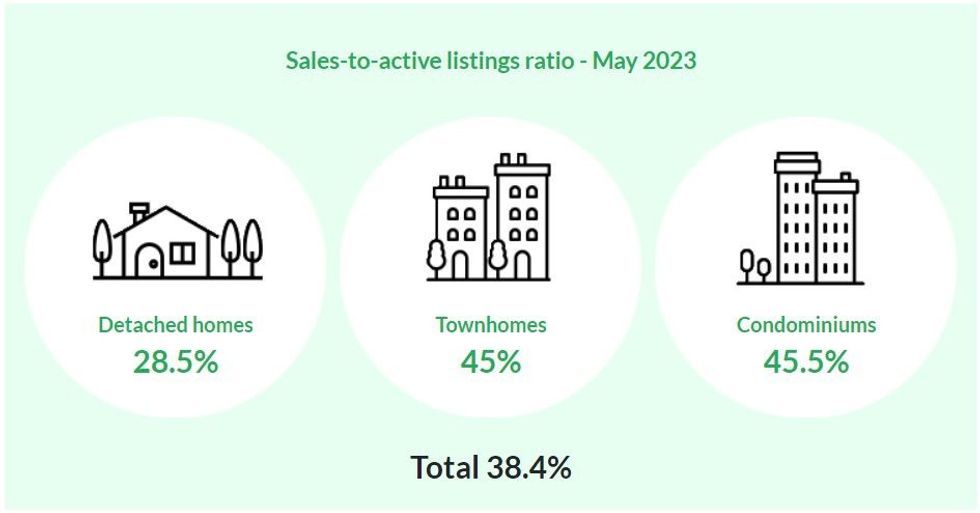
With 3,381 home sales and 8,809 total active listings after May, the sales-to-active-listings ratio is now at 38.4% -- well into sellers' territory. Furthermore, last month, the ratio was at 32.7%, indicating further movement towards favouring sellers.
This was also true across all residential property types. The sales-to-active-listings ratio for single-detached homes, townhouses, and condominiums were, respectively, 24.4%, 40.1%, and 37.4% at the end of April. By the end of May, those were 28.%, 45.0%, and 45.5%.
 REBGV
REBGV
Prices Continue Trending Up
The composite residential benchmark price in Metro Vancouver for May was $1,188,000, a 1.3% increase compared to the $1,170,700 last month, but a 5.6% decrease compared to May 2022.
By property type, the benchmark price was $1,953,600 for single-detached homes, $1,083,000 for townhouses, and $760,800 for condominiums.
All three represent minor improvements of less than 2% from April 2023 and 2-7% decreases when compared to May 2022.
"Back in January, few people would have predicted prices to be up as much as they are -- ourselves included," says REBGV Director of Economics and Data Analytics Andrew Lis. "Our forecast projected prices to be up modestly in 2023 by about 2% at year-end. Instead, Metro Vancouver home prices are already up about 6% or more across all home types at the midway point of the year."
READ: New Listings In Fraser Valley Surge As Delayed Spring Activity Arrives
According to REBGV, this is the sixth consecutive month that housing prices have increased in Metro Vancouver, a welcome sign to many after a slower than usual start to the year.
"If mortgage rates weren't holding back market activity so much right now, I think our market would look a lot like the heydays of 2021/22, or even 2016/17," added Lis.