It wouldn't be difficult to tell what time of year it is just by looking at home sales data, because, like clockwork, market activity is picking up once more, according to statistics published by the Real Estate Board of Greater Vancouver (REBGV) on Tuesday.
In April, the Greater Vancouver region registered 2,721 residential home sales, an 8.4% improvement from the 2,511 recorded in March.
Although an improvement, REBGV notes that the total is a decrease compared to both the 3,281 recorded in April 2022 and the 10-year average of 3,249.
April also saw 4,307 new residential listings in the region, about on par with the 4,317 registered in March, but another sizeable decrease when compared to the 6,128 added in April 2022 and the 10-year average of 5,525.
With those new listings, the total inventory of active listings in the region is now up to 8,333. This time last year, the total was 9,176, and the 10-year average is 11,117.
All this being said, the improvement in home sales in the short-term is a sign of market confidence.
"The fact we are seeing prices rising and sales rebounding this spring tells us home buyers are returning with confidence after a challenging year for our market, with mortgage rates roughly doubling," said REBGV Director of Economics and Data Analytics Andrew Lis.
The Market Lean
With this uptick in activity, is there an advantage to be gotten? And if so, for buyers or sellers?
With the aforementioned statistics, we can identify both the sales-to-new-listings ratio and the sales-to-active-listings ratio, two quantitative indicators of whether the market is leaning in any direction.
For the sales-to-new-listings ratio, a ratio 40% or lower is considered to be favouring buyers, a ratio 55% or higher is considered to be favouring sellers, and anything in between is considered a balanced market.
After 2,721 sales and 4,307 new listings in April, the sales-to-new-listings ratio is now 63.2%, up from 58.2% after March, indicating that there is movement towards favouring sellers.
For the sales-to-active-listings-ratio, a ratio of 12% or lower is viewed as favouring buyers, a ratio of 55% or higher is viewed as favouring sellers, and anything in between is viewed as a balanced market.
With 2,721 sales and 8,333 active listings at the end of April, the sales-to-active-listings ratio is now 32.7%, after being at 30.7% after March, reinforcing the continued movement towards favouring sellers.
Looking a bit deeper at individual property types, the sales-to-active-listings ratio is now 24.4% for single-detached homes, 40.1% for townhouses, and 37.4% for condominiums. At the end of March, those ratios were 23.3%, 36.7%, and 34.9%, respectively, so the movement is happening across the board.
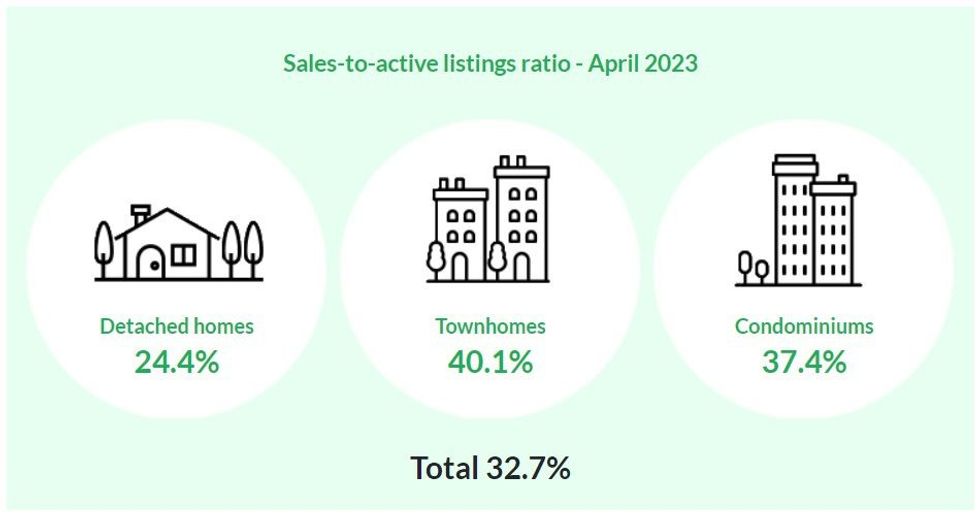 (REBGV)
Demand Resurgence and Price Escalation
"What we're seeing unfold so far this year is consistent with our prediction that near record-low inventory levels would create competitive conditions where almost any resurgence in demand would translate to price escalation, despite the elevated borrowing cost environment," said Lis. "At the crux of it, the issue remains a matter of far too little resale supply available relative to the pool of active buyers in our market."
Following April, the composite residential benchmark price is now at $1,170,700, after being at $1,143,900 after March.
READ: Ready, Steady, Go: Multiple Offers on Homes Rising in the Fraser Valley
By property type, the benchmark price is now $1,915,800 for single-detached homes, $1,078,400 for townhouses, and $752,300 for condominiums, all three of which are increases from March 2023.
"Home prices have increased about 5% year to date, which already outpaces our forecast of 1% to 2% by year-end," added Lis. "The year is far from over, however, and it remains to be seen if these price increases will be sustained into 2024."