Elevated costs of borrowing have permeated the Greater Vancouver real estate market, the Real Estate Board of Greater Vancouver (REBGV) said on Tuesday, but in predictable ways.
After recording 2,428 home sales in July, the Greater Vancouver region saw just 2,283 home sales in August. According to REBGV, that total is significantly higher than the 1,892 recorded in August 2022, but well below the 10-year average (2,663) for the month.
On the listings front, after seeing 4,649 new listings in July, the number of new listings that entered the market in August was down to 3,943, which was again a large improvement over August 2022 (3,340) but below the 10-year average (4,164) for the month.
With that new batch of listings, the number of the total active listings in the region is now up to 9,553.
"It's a bit of a tortoise and hare story this year, with sales starting the year slowly while prices increased due to low inventory levels," said REBGV Director of Economics and Data Analytics Andrew Lis. "As fall approaches, sales have caught up with the price gains, but both metrics are now slowing to a pace that is more in line with historical seasonal patterns, and with what one might expect given that borrowing costs are where they are."
The Market Lean
With the aforementioned statistics, we can calculate the sales-to-new-listings ratio and the sales-to-active-listings ratio, which are two quantitative indicators that can give us a sense of whether the market is currently leaning in any particular direction and whether there is a potential advantage to be found for buyers or sellers.
For the sales-to-new-listings ratio, a ratio of 40% or lower is considered to favour buyers, a ratio of 55% or higher is considered to favour sellers, and anything in between is considered a balanced market.
With 2,283 home sales and 3,943 new listings recorded in August, the sales-to-new-listings ratio is now 57.9% after coming in at 52.2% in July, indicating that sellers may have an advantage in the market.
For the sales-to-active-listings ratio, a ratio of 12% or lower is viewed as favouring buyers, a ratio of 20% or higher is viewed as favouring sellers, and anything in between is viewed as a balanced market.
With 2,283 home sales and 9,553 total active listings after August, the sales-to-active-listings ratio is now 23.9%, after coming in at 24.9% in July — another indicator that we're in a sellers' market.
By property type, the sales-to-active-listings ratio was 14.2% for single-detached homes, 30.3% for townhouses, and 31.9% for condominiums, indicating that sellers of townhouses and condominiums are much more likely to have an advantage than those of single-detached homes. (The same can be said for the Fraser Valley market.)
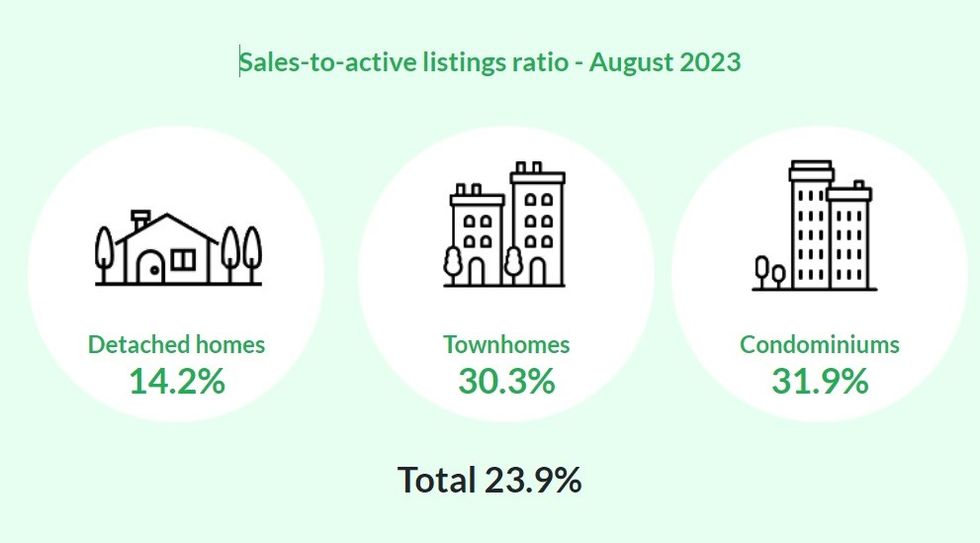 The sales-to-active-listings ratios for August 2023.(REBGV)
Price Gains Cooled Off
In July, the composite residential benchmark price in Greater Vancouver was $1,210,700. In August, that dipped slightly to $1,208,400.
By property type, the benchmark price is now $2,018,500 for single-detached homes, $1,103,900 for townhouses, and $770,000 for condominiums, which represent a 0.3% increase, 0.2% decrease, and 0.1% decrease compared to July.
All three benchmark prices represent an increase compared to August 2022, by between 3.3% and 4.4%.
While August saw dips in sales, new listings, and prices, the market as a whole this year has still performed better than many anticipated, notes REBGV.
"It's been an interesting spring and summer market, to say the least," said Lis. "Borrowing costs are fluctuating around the highest levels we've seen in over 10 years, yet Metro Vancouver's housing market bucked many pundits' predictions of a major slowdown, instead posting relatively strong sales numbers and year-to-date price gains north of 8%, regardless of home type."
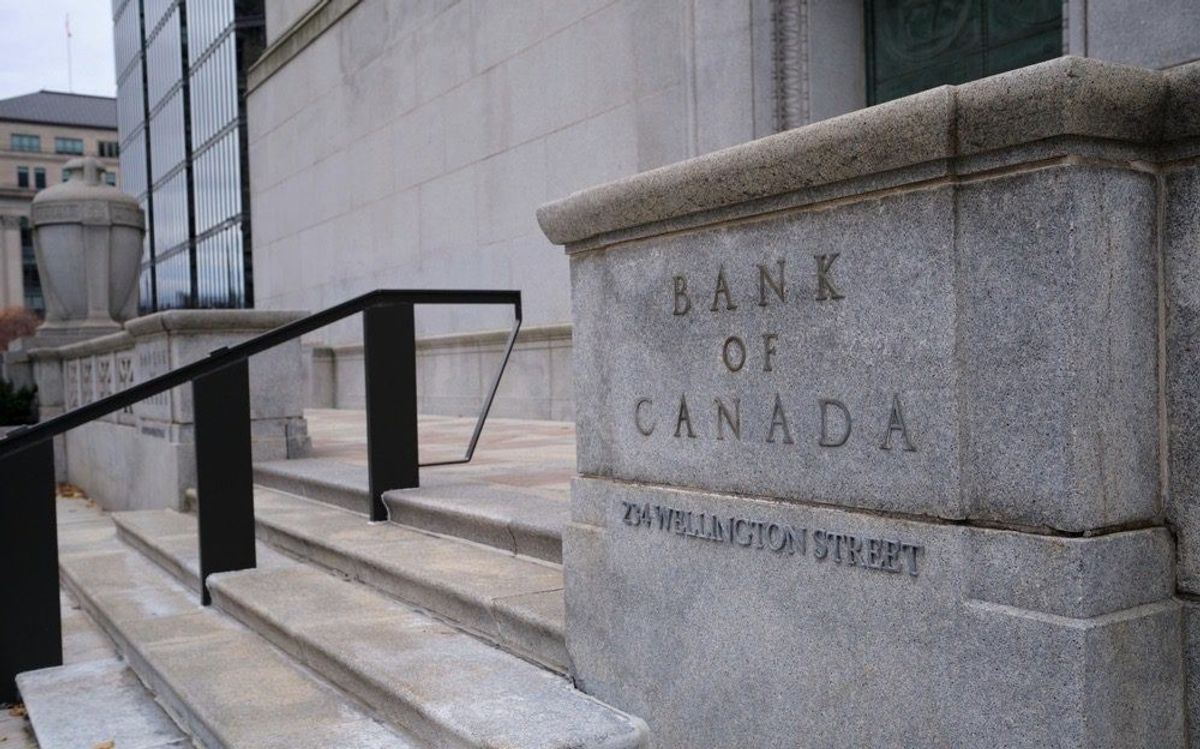
How the rest of the year may go, however, will likely be dictated by what the Bank of Canada does on Wednesday, when it makes its next policy rate announcement.