The COVID-19 pandemic isn't entirely over just yet, but we're getting there, and a new tool launched by Avison Young that can measure foot traffic in cities like Vancouver and Calgary gives us a little idea of just how close we are to normal.
One of the biggest effects of the pandemic was how it disrupted the way we live our lives. Stores that would usually welcome large crowds now had to limit the amount of people they could let in. Offices that were typically bustling and humming now had to ask people to work from home. Because of that, where people are -- at home or out and about -- and whether or not they're gathering can give us a sense of whether or not things are returning to normal.
Using anonymized cell phone location data provided by Orbital Insight, Avison Young's new Vitality Index can estimate foot traffic in 52 major cities across North America, allowing for foot traffic comparisons between pre-pandemic times and now (as of the week of September 19, 2022). Users can narrow down locations to property types -- such as government, office, or hospitality -- and identify a timeframe -- such as the week before lockdown (March 2, 2020), Black Friday 2020, or any week in 2022.
So: Have things returned to normal?
Vancouver
Foot traffic in Vancouver hit its low in the week of March 30, 2020, when total foot traffic including at all property types fell to just 28.7% of the pre-lockdown week of March 2, 2020. Foot traffic increased, however, during the summer, hitting 59.9% in the week of June 22, 2020.
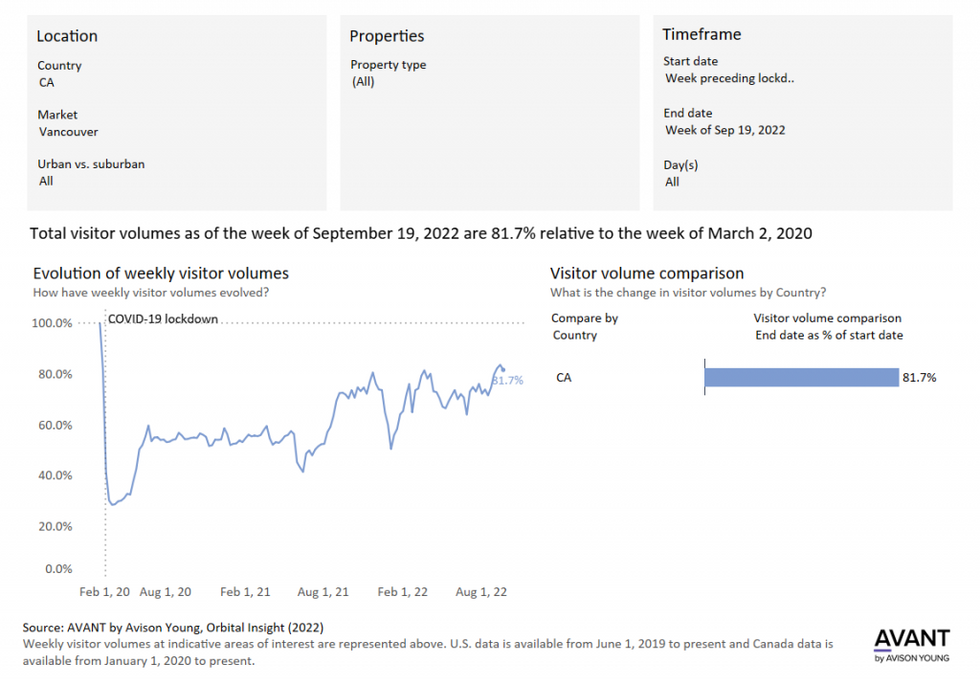
It then ebbed and flowed for nearly a year, before taking another dramatic dip to 41.6% in the week of June 14, 2021. That same week, Provincial Health Officer Bonnie Henry eased travel restrictions within the province and foot traffic correspondingly began increasing, peaking at 72.6% by the week of September 6. It then fluttered a little the next few weeks, before hitting another peak of 80.7% in the week of November 22, which was the week of Black Friday.
Immediately after that week, BC confirmed its first case of the Omicron variant on November 30, and foot traffic fell steeply to 50.6% by the week of January 3, 2022. Foot traffic then started to rise as quickly as it fell, hitting by 76.2% by the week of February 14, the same week when the Province lifted its restrictions on capacity limits and allowed bars and clubs to re-open. From there, foot traffic fluttered some more, but hit 83.4% in the week of September 12, the highest number since before the pandemic, indicating that things may be getting close to returning to normal.
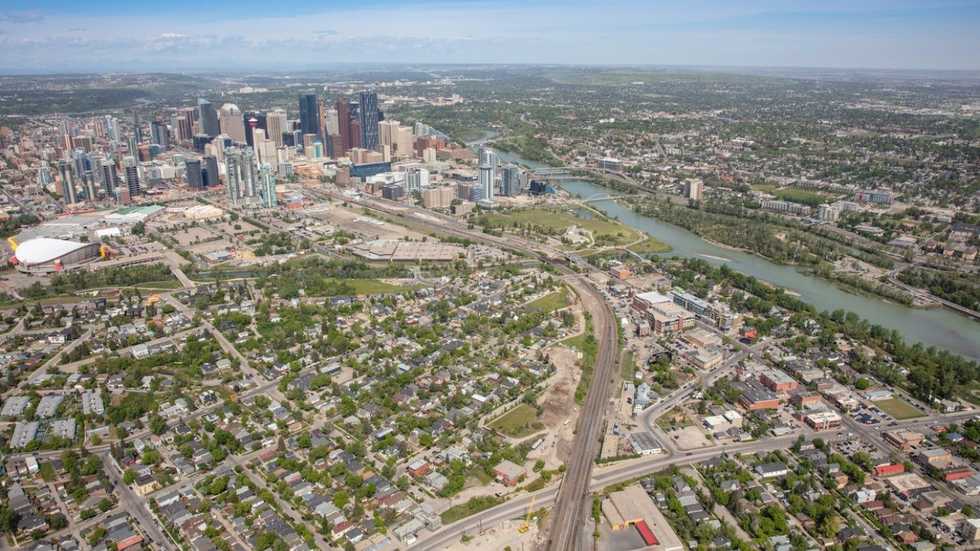
Calgary
Despite Alberta having their own restrictions and different timing when it came to easing them, how foot traffic changed in Calgary from before the pandemic to now has largely followed a similar pattern to what was seen in Vancouver.
Foot traffic in Calgary decreased and increased at roughly the same times as it did in Vancouver, but to lower valleys and higher peaks. While foot traffic dipped to 28.7% in Vancouver by the week of March 30, in Calgary, it fell all the way to 16.1%
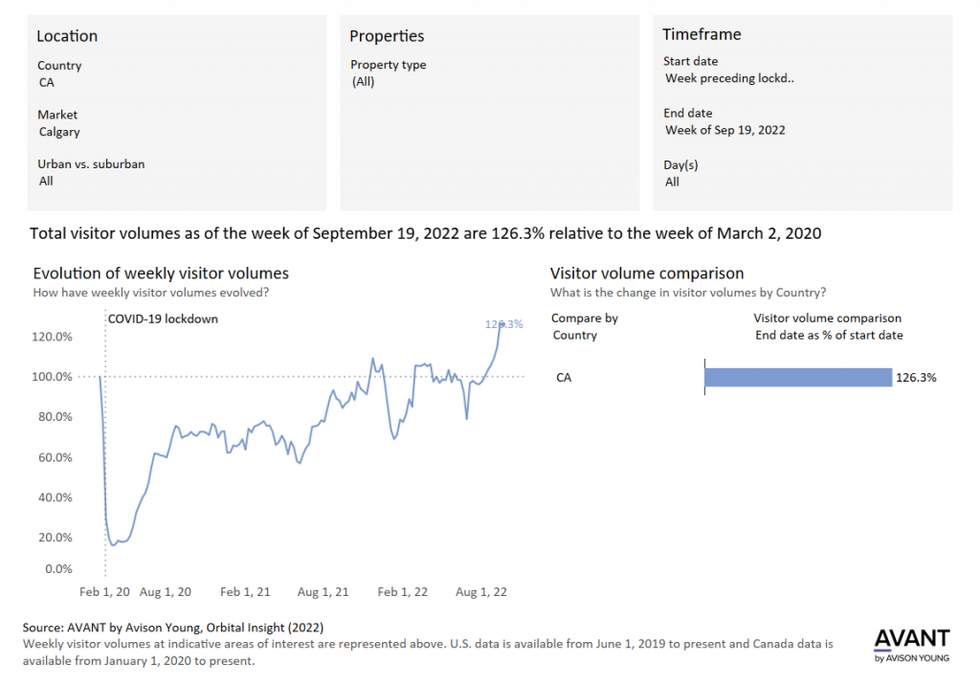
Things then began turning around, as foot traffic started increasing at the same time as it did in Vancouver, fluttering between 60% and 80% for the next year or so, while Vancouver levels hovered between 50% to 60%. Like Vancouver, foot traffic started on a steep increase in the summer of 2021, but while Vancouver hit a peak of less than 80%, Calgary saw a peak of 109.4% the week of November 22, 2021.
Vitality then dropped following Black Friday and into the new year, starting to increase again in January, hitting a peak of 105.7% the week of February 28 and hovering around 100% until dropping significantly in June, but then increased just as significantly immediately in July, and has remained on an upwards trajectory ever since, hitting a peak of 126.3% as of the week of September 19, indicating that Alberta may have fully put the COVID-19 pandemic behind them.
"We're at a moment in time where culture is driving foot traffic patterns -- and the Vitality Index provides insight into what, how, and when spaces are attracting people," said Avison Young’s Chair and CEO Mark Rose in a press release announcing the tool's launch.
Avison Young believes that this data will allow urban planners, employers, and commercial real estate stakeholders to make well-informed decisions, such as the right amount office space or the optimal location for a new development.
One such insight Avison Young has found is that traffic to flexible office providers across North America have been significantly higher than to non-flex offices, measuring at 79.1% as of the week of September 19 compared to 45.2%. Another is that traffic to retail corridors is showing recovery, down just 18.9% compared to the week before lockdowns, with more recovery on weekends than weekdays.
Avison Young says it's a tool to see "how people and places are moving forward." In other words, it's a tool that shows how people are moving on.