Although Canada's residential real estate markets are facing a significant supply shortage, the housing stock grew at a faster pace than the total population in major cities in recent years.
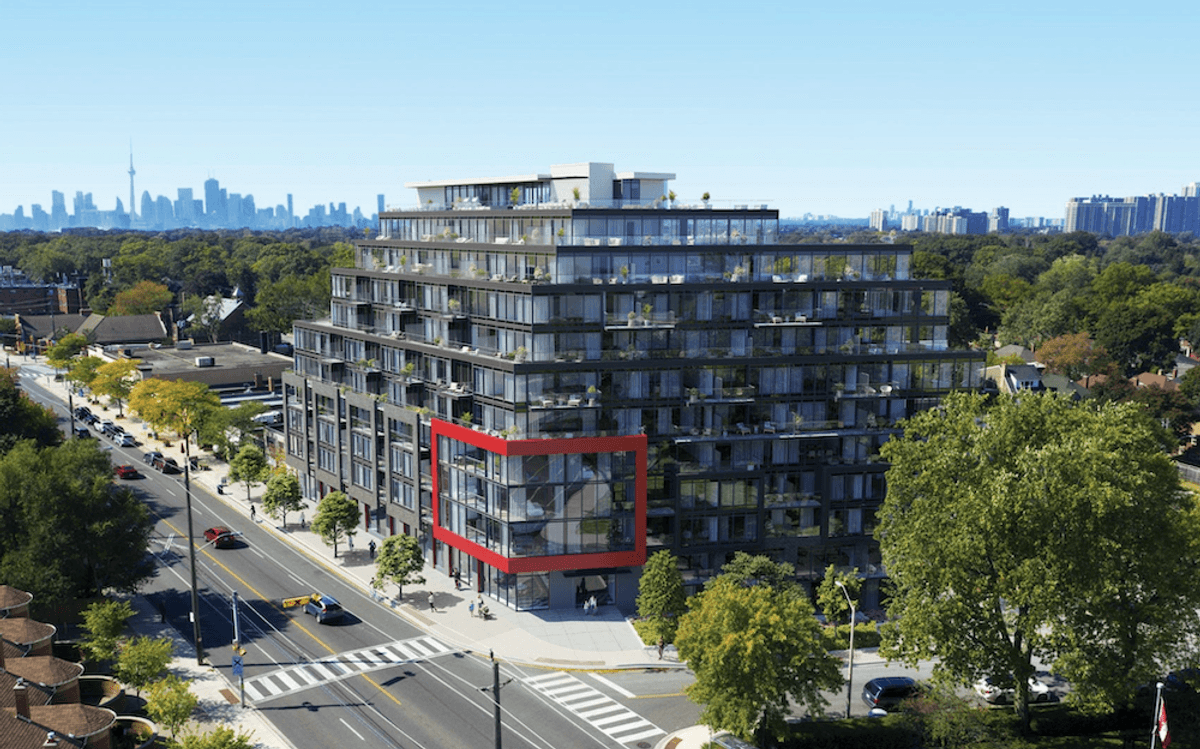
From 2019 to 2021, the population in the Toronto census metropolitan area (CMA) grew by 1.3%, while the region's housing stock increased by 3.5%, or 61,320 properties.
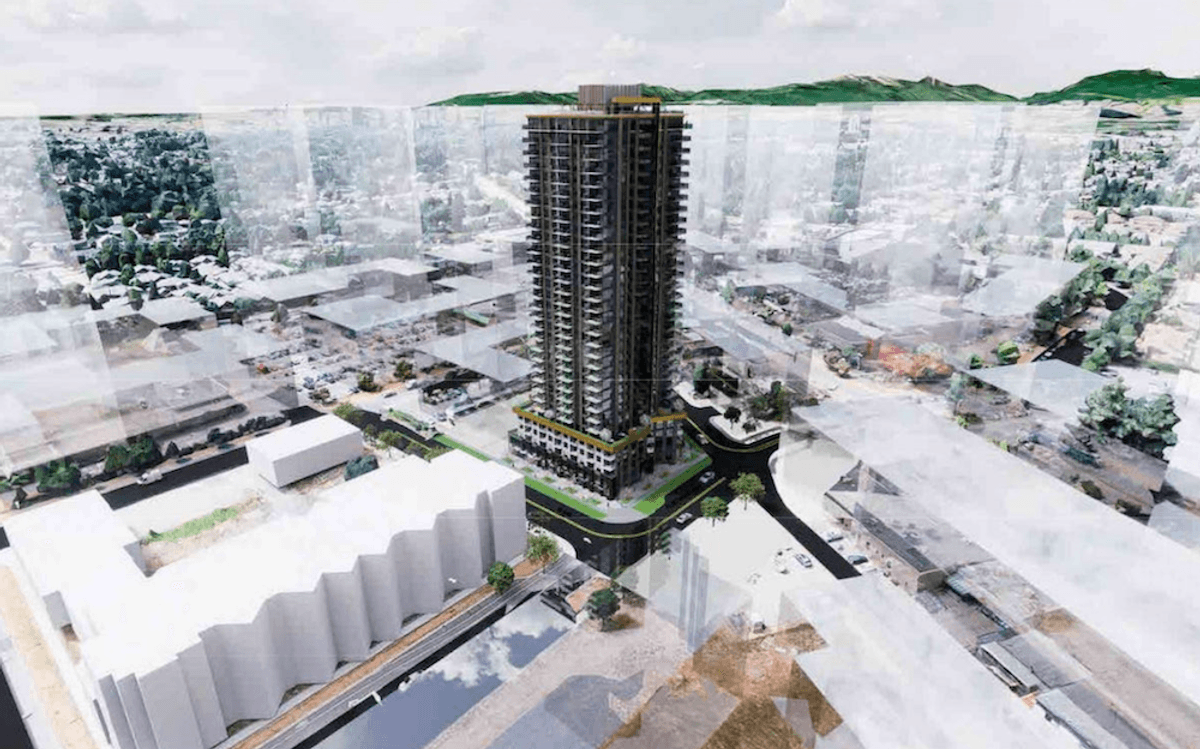
A similar trend was seen in the Vancouver CMA, with the population increasing 2.1% as the housing stock jumped by 3.6%, or 28,085 properties.
This data is included in the latest release from the Canadian Housing Statistics Program, a data project from Statistics Canada.
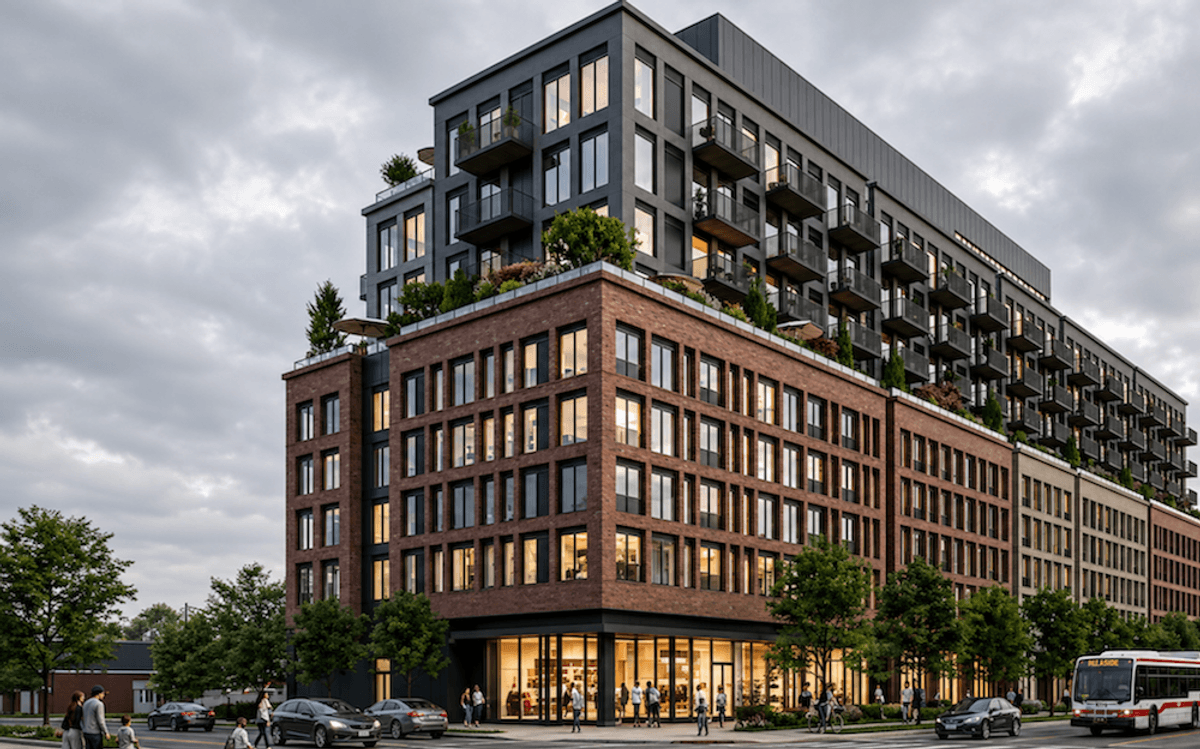
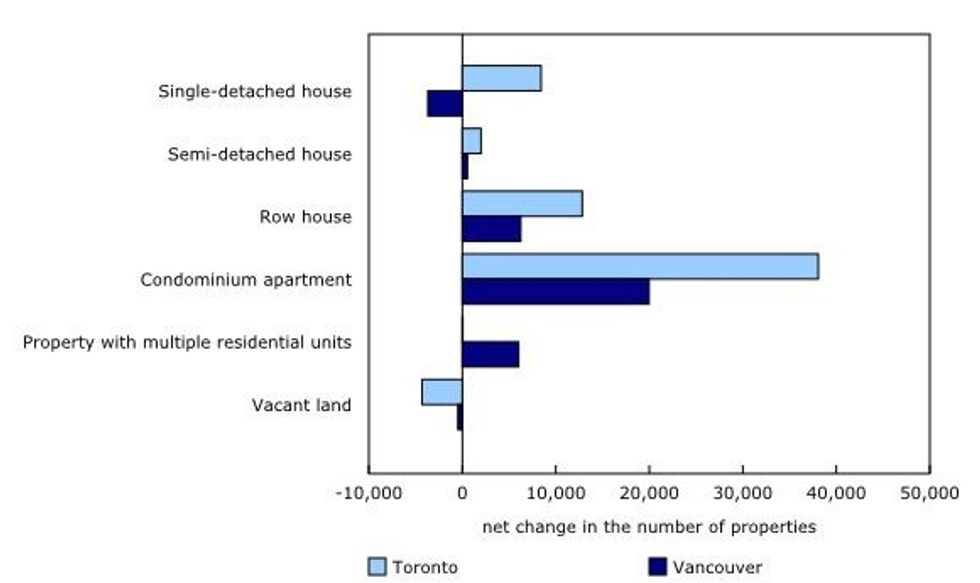
Condominium apartments accounted for more than half of the growth in both CMAs, with the housing type increasing by 38,070 units in Toronto and 19,970 units in Vancouver from 2019 to 2021. Both regions also saw the number of row houses surpass the number of single detached houses.
Toronto added 12,825 net new row houses and 8,425 net new single-detached homes; Vancouver saw the former increase by 6,245 and a net reduction in the latter of 3,680.
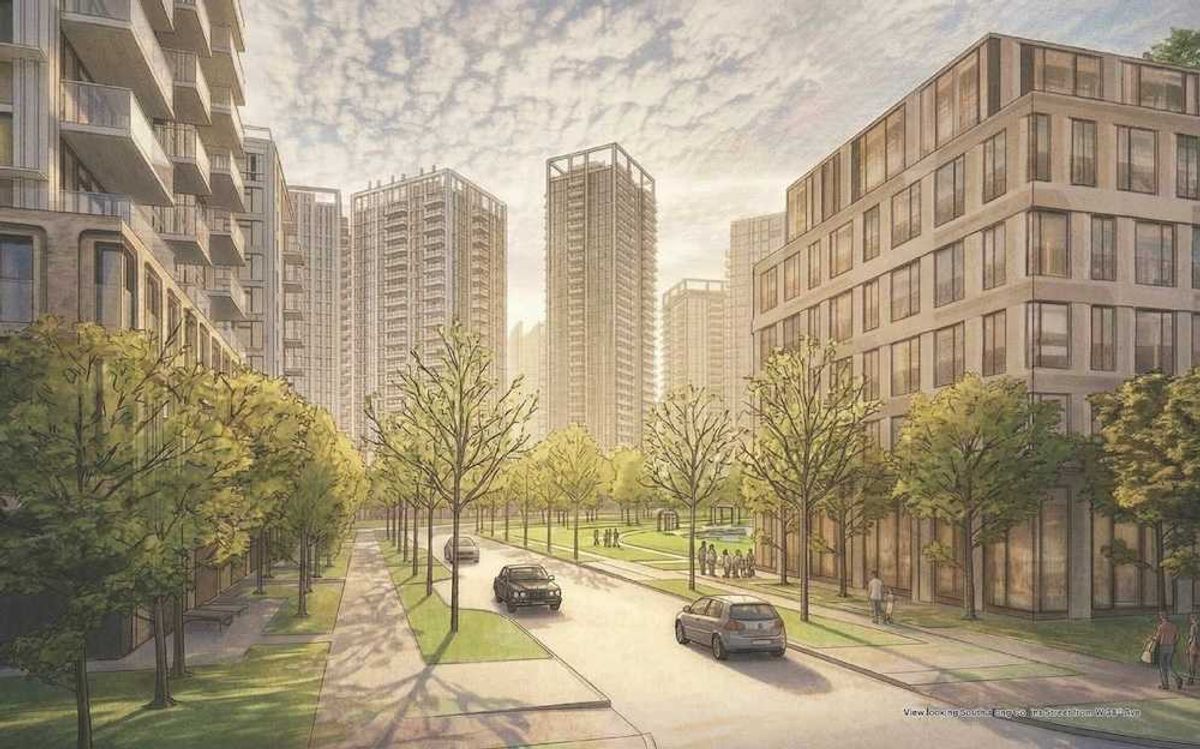
Differences appear when properties with multiple residential units -- which StatCan noted are a "prime source of rental supply" -- are concerned. Toronto added just 55 such properties from 2019 to 2021, while Vancouver saw a net increase of 6,020.
The discrepancy is due to differences in densification -- Toronto produces a higher number of large housing structures, such as rental apartment towers, while Vancouver opts for more concentrated forms of density, such as duplexes and laneway suites.
 Statistics Canada
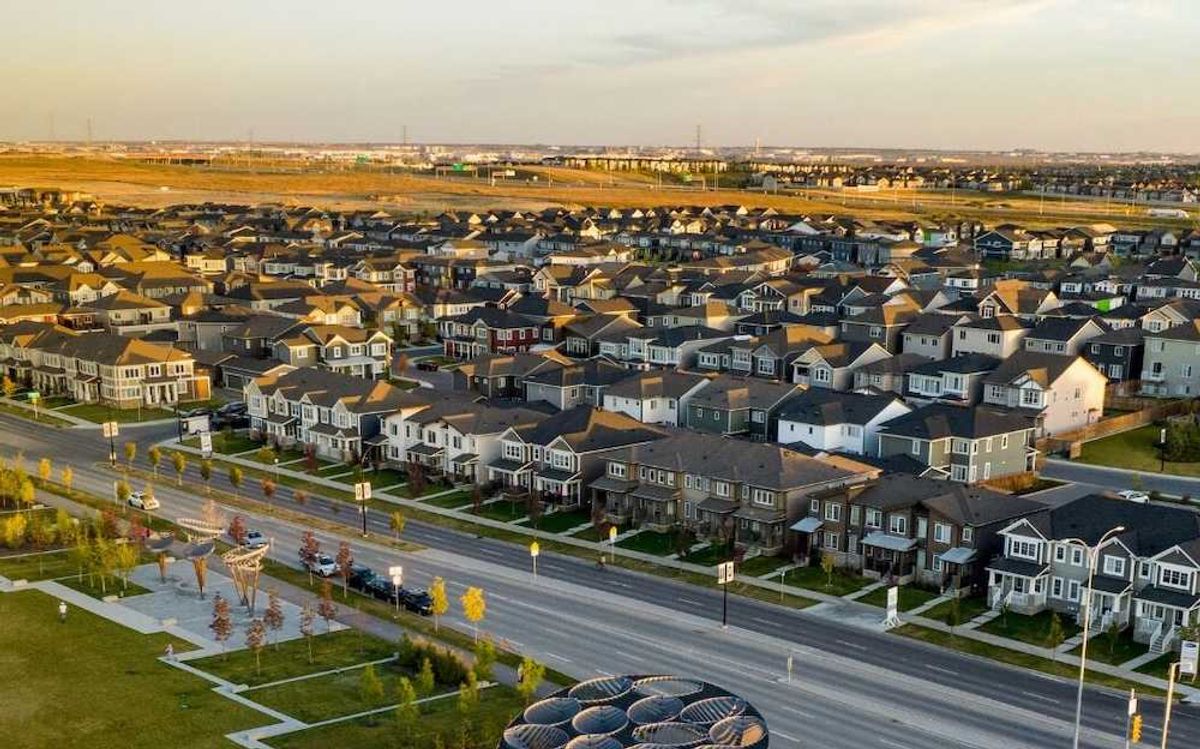
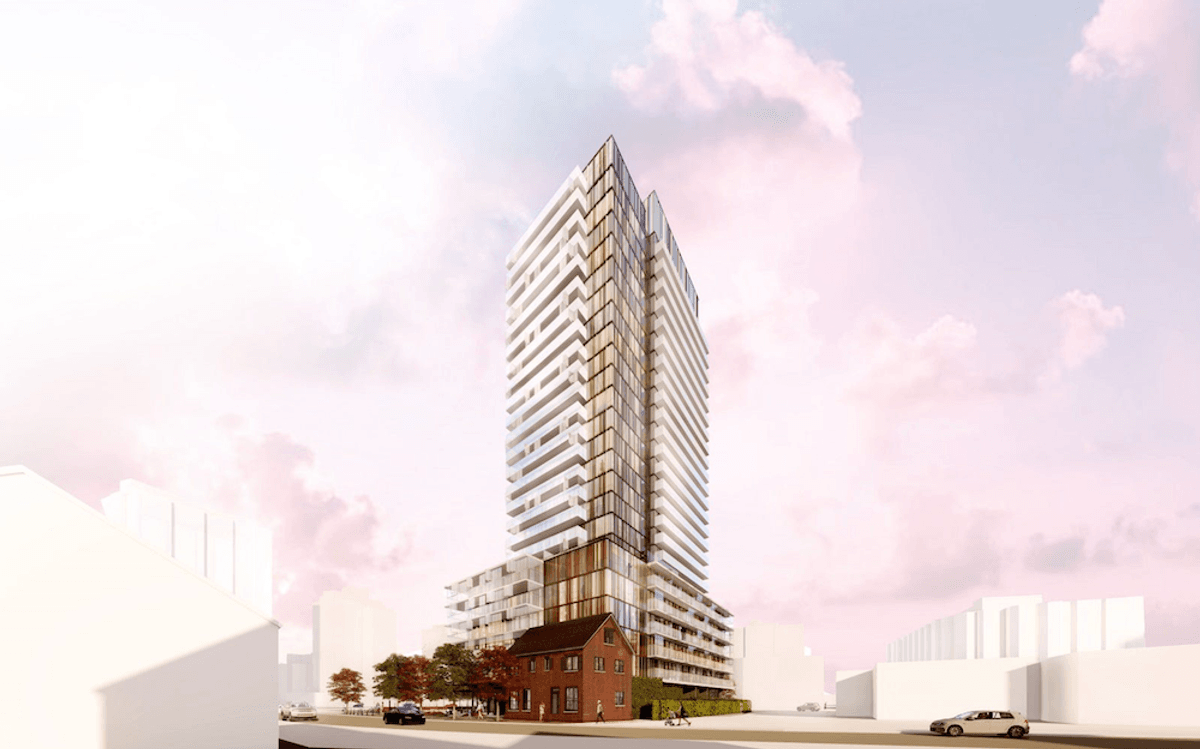
Another densification trend playing out in Vancouver is the shrinking of new condos, with those built in 2016 or later being 13.8% smaller than those built in the 1990s, amidst the expansion of new single-detached homes, which, with a median living area of 3,600 sq. ft., are the largest of all CMAs covered in the report.
Despite an increase in the housing stock, both CMAs face significant affordability issues that are attributable to a number of other factors, such as interest rates and construction constraints.
"While population and housing stock growth are indicators of supply and demand, they are not the sole determinants of housing prices in these CMAs," StatCan said. "Other factors such as income, macroeconomic conditions, and pre-existing shortages in housing supply also play an important role."
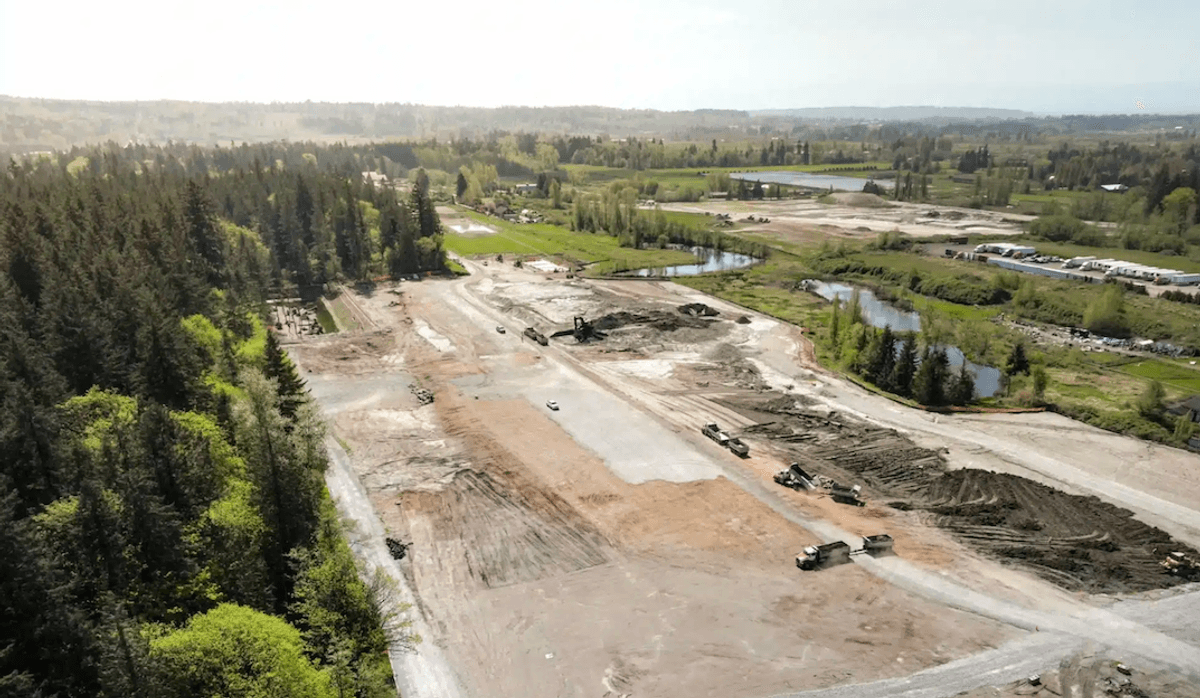
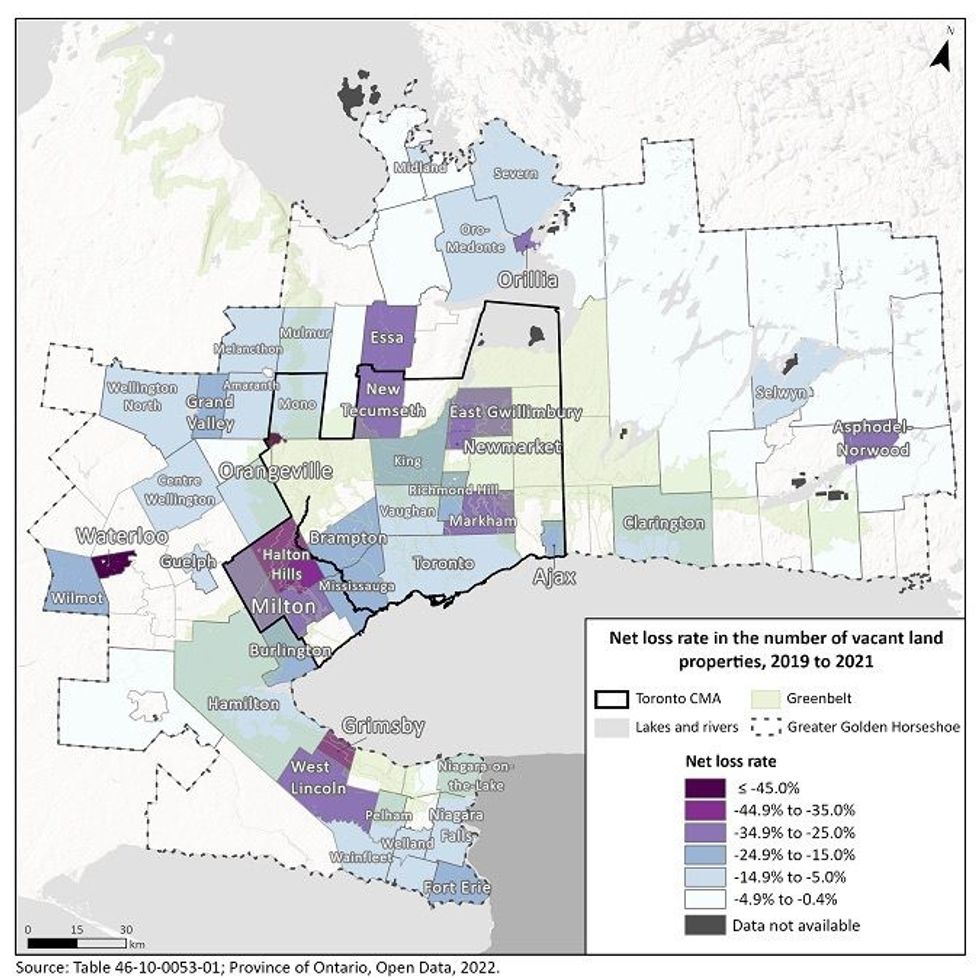
As noted in the report, vacant land serves as a key input to residential building construction, and is therefore a "major determinant" of housing supply and affordability. From 2019 to 2021, Toronto saw the largest decline in vacant land of any CMA, with an overall decrease of 11.8%, or 4,305 properties.
On a provincial level, Ontario saw a decrease of 6,680 properties, a trend which can be explained by new greenfield residential construction and adjacent properties being bundled together in a single parcel.
Some of the largest declines were seen in East Gwillimbury (-1,190) Brampton (-490), Markham (-490), and the City of Toronto (-480). The figures represent overall declines of 34.8%, 16.5%, 26.5%, and 9.5%, respectively.
 Statistics Canada