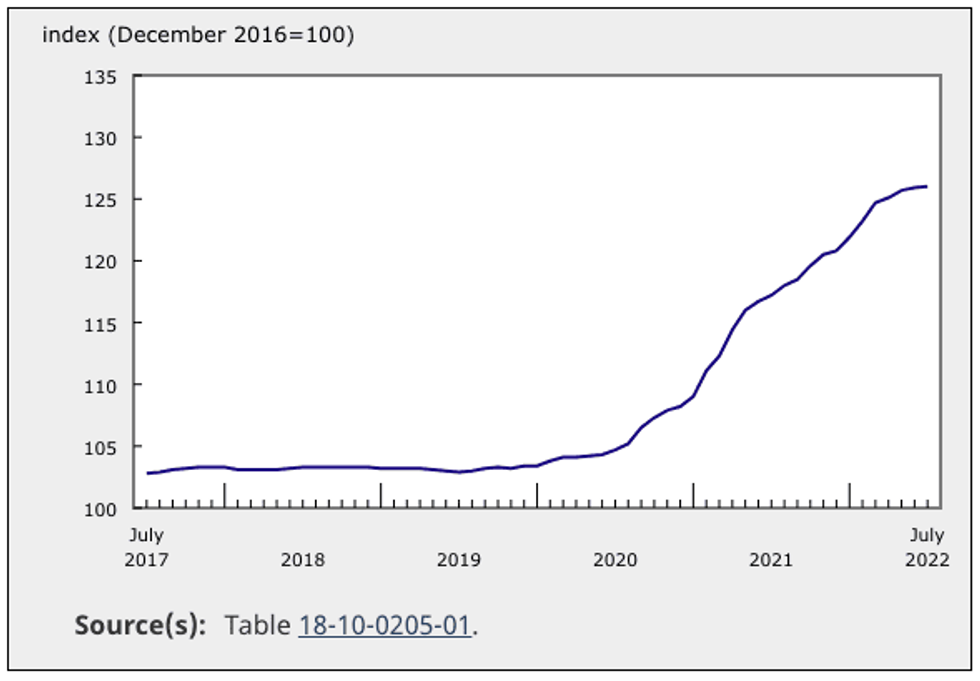
Month over month, new home prices are rising at a snail’s pace in Canada.
This is according to Statistics Canada’s New Housing Price Index for July 2022, which showed that new home prices rose by just 0.1% between June and July.
 Statistics Canada, New Housing Price Index, July 2022
Compared to previous months and years, the 0.1% increase is especially negligible. In the first quarter of this year, new home prices rose by 1.1%. In the second quarter, by 0.3%. Additionally, July’s MoM increase has been the most modest the market has seen since June 2020.
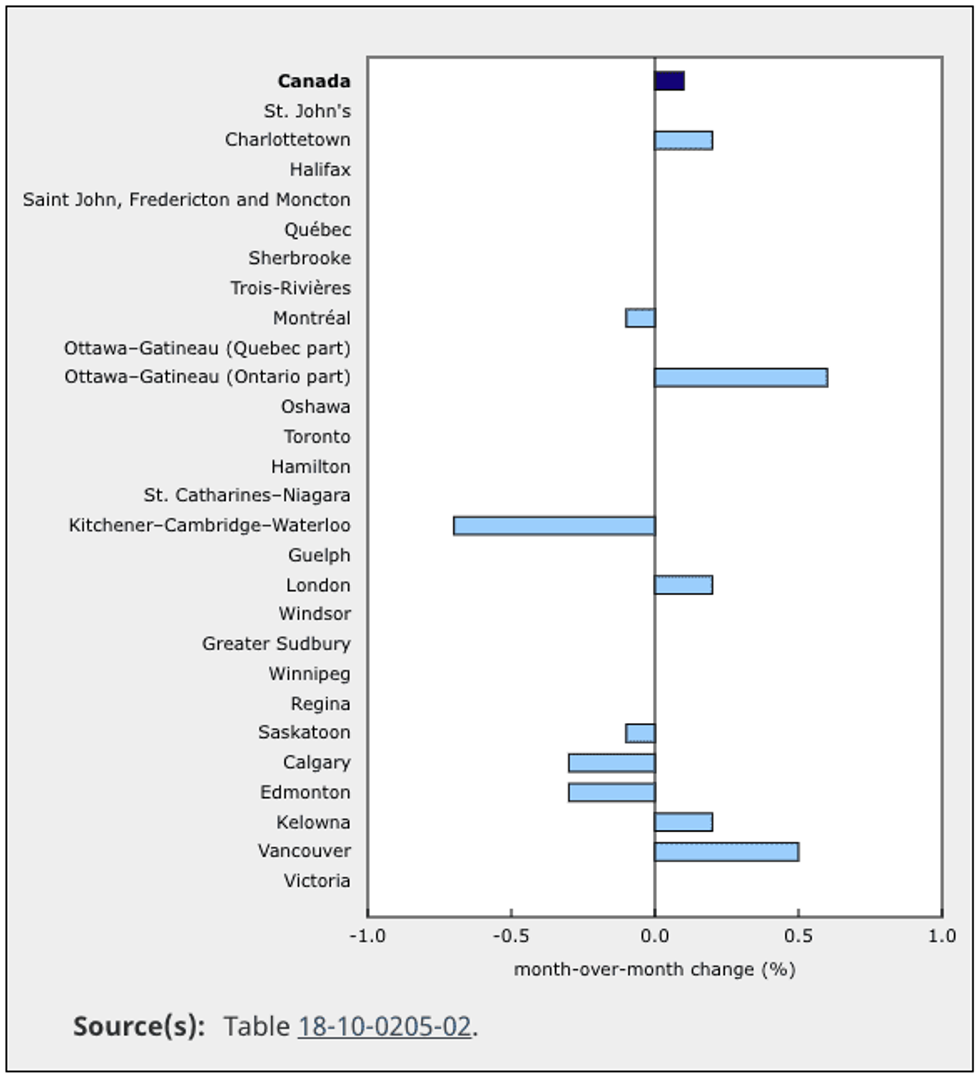
While prices were unchanged in 17 of the census metropolitan areas (CMAs) surveyed, they were up in five CMAs and down in five CMAs as well.
Ottawa, Vancouver, Kelowna, London, and Charlottetown saw MoM Increases
Of the five CMAs that saw monthly price increases, Ottawa and Vancouver saw the most notable growth.
 Statistics Canada, New Housing Price Index, July 2022
In Ottawa, new home prices rose by 0.6% from June to July, and builders attributed this activity to strong market conditions. But according to data from the Ottawa Real Estate Board, resale activity in the city is showing signs of cooling, with average prices in the resale market seeing a 7% decline from June to July. The thinking is that while both the resale and new home markets are being impacted by recent interest rate hikes, the new home market is feeling the effects at a slower pace.
Vancouver saw new home prices increase by 0.5% from June to July, with builders noting that increased labour and materials costs are affecting the prices. Additionally, data from the Real Estate Board of Greater Vancouver indicated that Vancouver had a sales-to-active-listings ratio of 11.8% for single detached homes and 20.0% for townhomes in July. The detached single home market has the potential to see downward price pressure if a sales-to-active-listings ratio under 12% persists. Townhomes may see upward price pressure if a sales-to-active-listings ratio above 20% persists.
The higher sales-to-active-listings ratio for townhomes can be attributed to the fact that townhomes are a more approachable purchase for buyers broaching Vancouver’s housing market. The benchmark price for a townhome was almost half of that of a single detached home in July.
Kitchener–Cambridge–Waterloo, Calgary, Edmonton, Saskatoon, and Montreal saw MoM Decreases
Of the five CMAs that saw price decreases between June and July, Kitchener–Cambridge–Waterloo saw the most drastic drop of 0.7%. That figure marks the steepest decline in Kitchener–Cambridge–Waterloo new home prices since July 2019 and can be attributed to the fact that 1,174 new listings were added to the market in July, compared to only 550 sold.
Meanwhile, the benchmark price for a single-family home in the region declined by 5.7% from June to July. This decrease is chalked up to rising mortgage rates and inflation.
Nationally, New Home Prices Increased YoY, with Calgary and Winnipeg Leading the Pack
On an annual basis, new home prices across Canada saw moderate growth, rising 7.5% from last year. But that figure has been falling for four consecutive months.
Most notably, new home prices rose by 14.8% YoY in Calgary. This is the third consecutive month where Calgary has led the pack for YoY increases. According to the Calgary Real Estate Board, the city saw record-breaking residential sales in July. Meanwhile, listings for homes under $500,000 fell 18% and listings for homes over $500,000 rose by 20% YoY.
Of all housing types in Calgary, sales activity for detached homes fell by 19% and semi-detached by 17%. Conversely, sales activity was strong for apartments and row homes, increasing by 49% and 23% respectively. A shift towards apartments and row homes indicates that buyers are favouring affordable property types.
In Winnipeg, new home prices increased by 14.5% YoY, although this number has been dropping since March of this year. In the first half of 2022, the sales-to-listings ratio for single-family homes fell to 72%, compared to 83% in the first half of 2021. These numbers point to a sellers' market conditions and could also be attributed to less competition for listings available on the market.