In preparing for this month's article, I did my usual research, reading up on what the economists and the data sellers in the new home business are saying, and digging into our own stats from the thousands of new home transactions that run through our system.
Quick summary: our data confirms what’s being said by others right now.
New home sales rallied to normal levels in the spring, but cooled off again when the Bank of Canada (BoC) came off the sidelines with an interest rate hike, momentarily shocking sales velocities to levels under normal conditions again. Similarly, when I look at most regions, prices are fairly flat if not slightly up — which is no surprise when we consider construction costs — and I can see clearly that projects don’t launch unless they hit those numbers.
Conclusion: Q3 2023 has looked a lot like Q3 2022, marked by low inventory, lower sales volumes, and flat prices.
So I asked myself, what am I going to say to offer some value to the conversation, or at least keep you mildly entertained? Luckily, I found a few important, very current, and not yet reported data points worth noting.
Price-Point Demand Is Lower; Prices Are Not
Prices are flat, yes, but the average sale price per unit is way down. To get this number, we take the total value of all homes sold through our system and divide it by the total number of sold-firm homes in the period. From here, we find that the average value of a home sold this year was down 18%, at roughly $725,000 vs. $860,000 the same time last year.
Let me be clear, average home prices on a national and averaged basis can be — and have been — very dangerous numbers that the media has used to cry “prices are falling”; which is emphatically not true, as many have stated and we have confirmed. In addition, these numbers don’t really relate to what the price of your home is, and it would be irresponsible for anyone to suggest that prices are down 18% — because they are not.
What is true is, if we plot all of Canada’s new home sales from the quarter on a price graph, the demand concentration is greatest at a lower number today than it was a year ago. So essentially, interest rate hikes have worked in bringing down demand for higher price points.
To say it another way, more people are buying homes at a lower price than they were a year ago, but they’re not necessarily buying the same home for less.
Let’s dissect this a bit more.
Going Deeper
I ran some math and was not surprised to see that these two price points are actually the same number to a home buyer. An $860,000 mortgage last year, with 20% down for 25 years at the rates available then (which I determined to be 4.5%), and a $725,000 mortgage at today’s rates (which I ran at 6.35%) are almost identical, at roughly $3,800/mo. It makes perfect sense that people have adjusted the price of the home they are after to keep their payment identical (shockingly, within 2 digits). This doesn’t mean they are paying less for the home they wanted; it means the majority of people are looking for homes that are priced lower, and this is likely happening throughout the continuum.
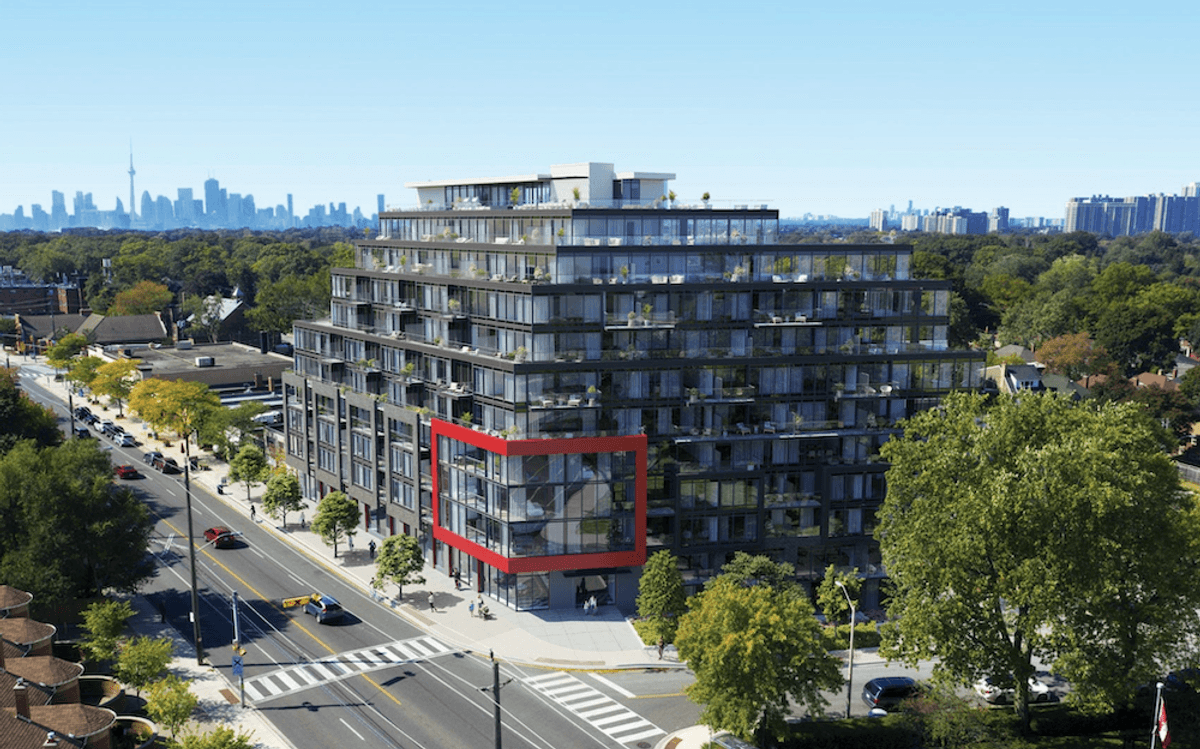
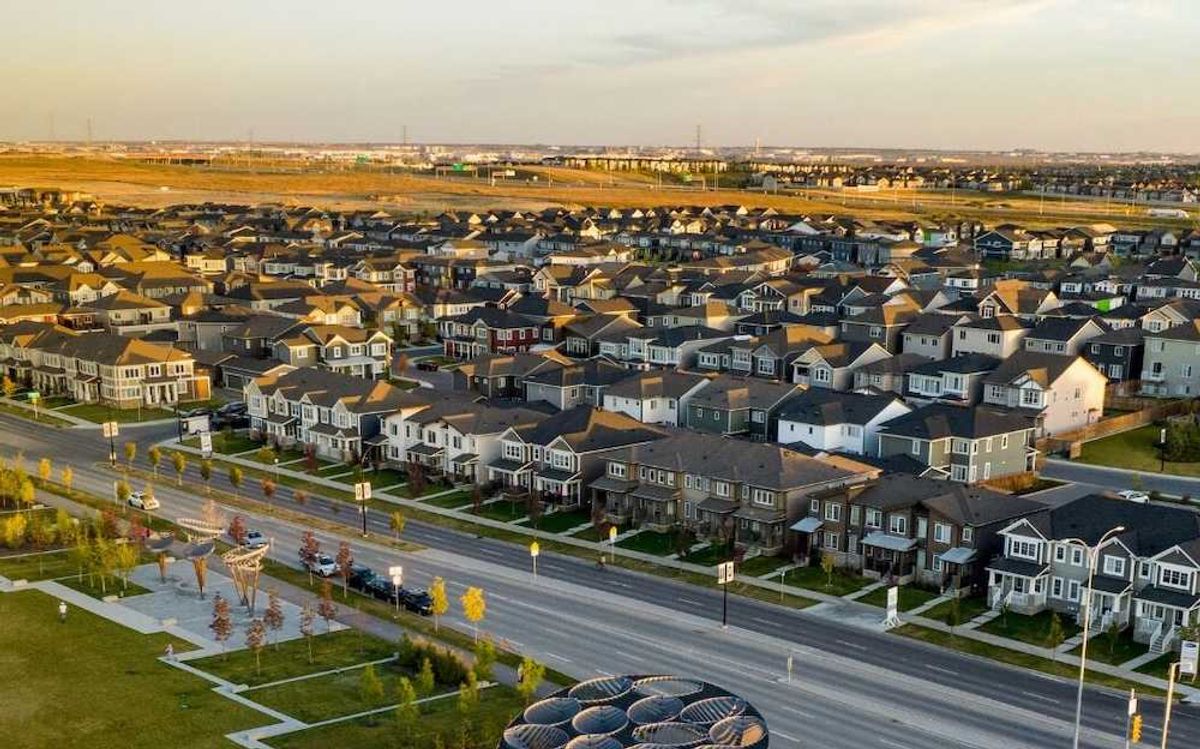
This is made clear when I consider geography and product type in project data. And voila, sales volumes are the same, but are further afield and moving away from the downtown cores while including more lower density wood-frame suburban products. This echoes what I hear personally from sales agencies, who have referred to downtown Toronto and Vancouver presale markets as “ghost towns” and single-family as being for luxury buyers only, while some suburban condo markets are red hot.
But if demand is shifting towards lower prices, then why aren’t prices falling as well? Two answers. First, demand is substantial, so the continuum is full and broad, and second, supply is majorly constrained across the board. So even though there are fewer buyers for the higher price points, there are still buyers, and supply has been constrained to meet demand so there is no surplus in the segment; prices stay flat.
Sales Volumes Point To Stability
Sales starts, as defined by new contracts written, are roughly the same — if not slightly elevated year-over-year — but sold firms have dramatically increased. What does this mean? Roughly the same number of deals are getting started, but far more are making it through rescission and resulting in firm contracts.
This speaks to an increase in consumer confidence this year over last year, or at least more certainty around where we’re at. The data suggests that last year there was roughly the same number of people out shopping for a new home, but in the midst of rate hikes of 1.75% in Q3 2022, people were understandably uncertain (and less likely to follow through).
Today, we are 18 months into this down cycle, and only had one quarter-point increase in Q3; in addition, prices have not fallen, and rents only continue to rise, so buyers have increased confidence that their new purchase won’t be immediately devalued. So, the data suggests that anyone shopping for a new home today is serious, and will follow through if they have gone through the trouble of writing a contract.
In summary, peak demand and sales volumes will continue to target, roughly, the same monthly payment, and with confidence. This will move the average price point up and down with rates, but keep sales flowing. Actual home prices will only fall if supply starts to exceed demand for any given price point, but only to a maximum of the difference in affordability caused by interest rates. And so far, supply remains constrained across the continuum, so it’s likely prices remain flat for most markets.
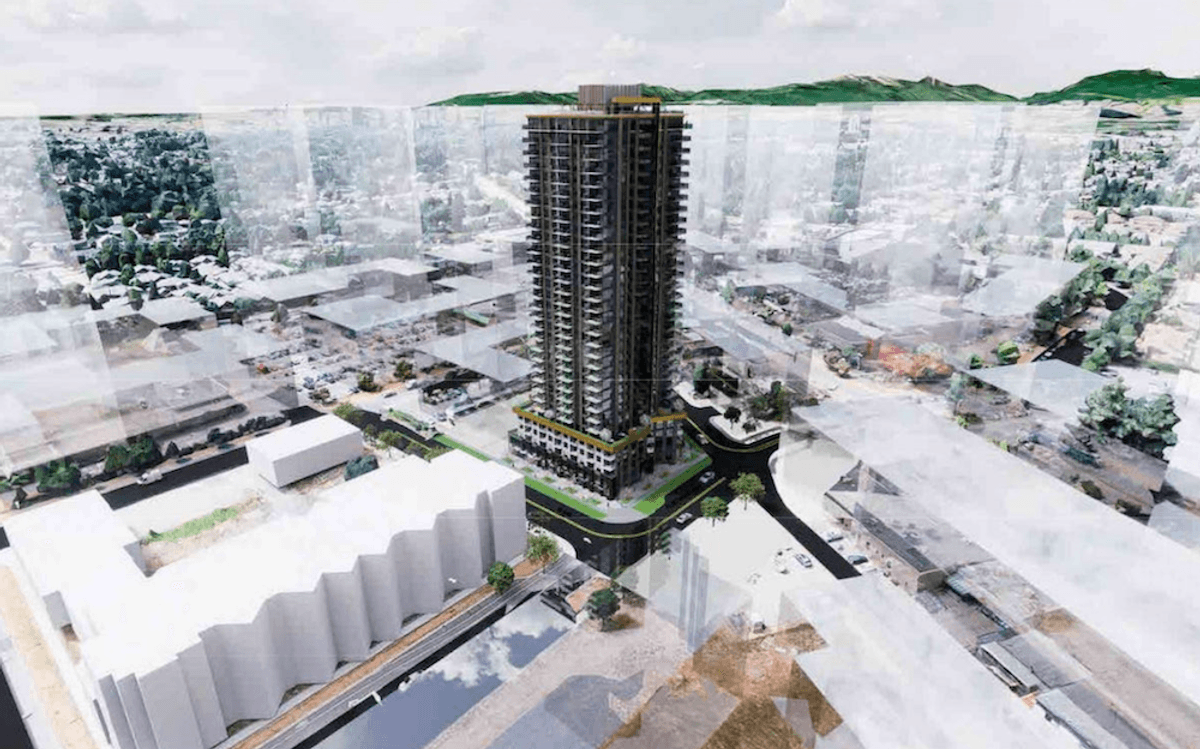
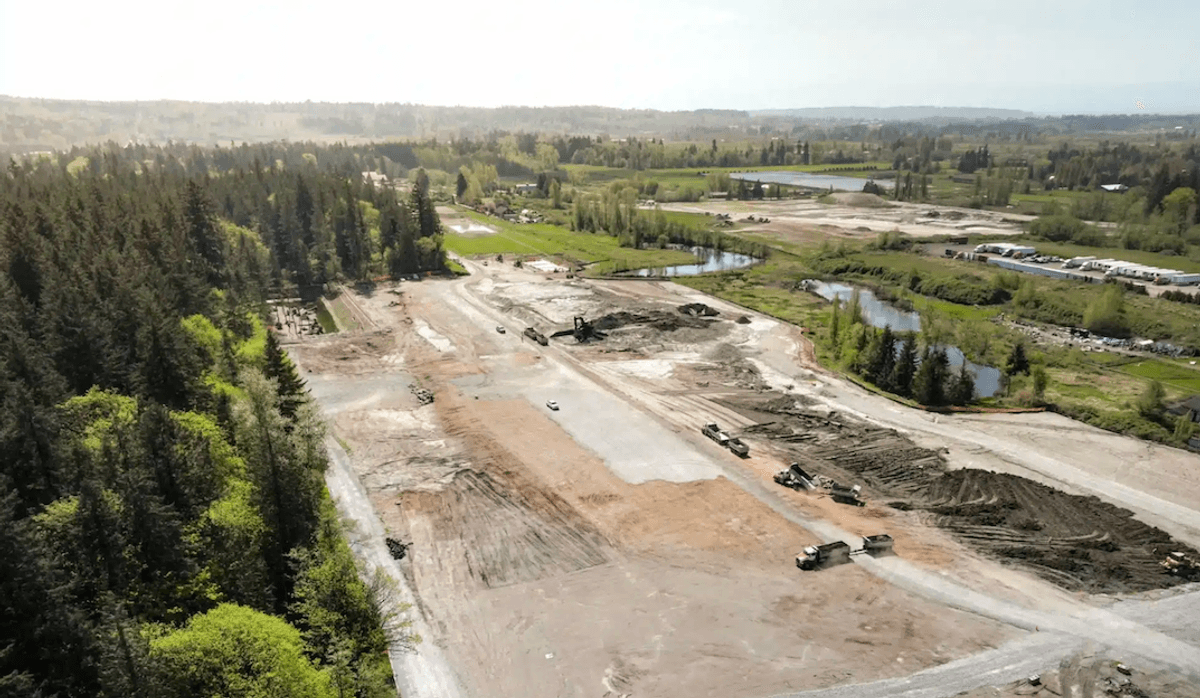
Based on this, we are likely to continue seeing developers respond to demand with more project launches further away from downtown core areas, and with more lower-density wood frame projects coming to market. If rates continue to rise then demand will push further afield, and will increase for smaller/denser housing types, where absorptions will remain strong. Conversely, developers will continue to constrain supply for very urban, high density projects, and will look to make a rebound once rates start to fall in the new year.
The only increase in supply we might see will rely solely on purchasers in these urban areas, who are facing renewals or closings before rates fall; they may have to resell immediately, or assign their units, and this will be exacerbated if rates increase again. With that said, it doesn’t look like there will be enough of these in the near-term to increase supply to a point where it would crash these areas. A more likely scenario is for prices in these areas to be suppressed to a small degree, for a short period, until rates ease — which is expected in mid 2024.
READ: Expert: New Condos Are The Housing Type Canada Needs Right Now
Sadly, there is not nearly enough affordable social or market rental stock to ease the pressure, which will only push rental prices up (and create more pressure). Further, the cost to build new stock will ensure the prices coming in a couple years for that finished product won’t be any lower than what they are now. These strong rental rates will continue to support the math for home ownership and keep demand elevated for some time.
So, my bet is that the pain will continue for another 6 months, increasing if there is another rate hike, only to start relieving sometime in the spring of 2024. Over the next year or two, prices will not have fallen for ownership or rental, more people will live in smaller homes further away from the city, and mortgage rates will have been reset to a new normal, ~4-5%.
I’m sorry I don’t have better news to report, but it would seem we are in a stalemate between supply and demand for housing — of any and all kinds. Prices for all housing types are only going up, and it’s not going to get any easier for developers to bring much-needed supply to market. Purchasers are using every penny they have saved (or can muster) to stay housed, waiting for some relief in the form of lower rates and/or more supply, which are still a ways away. Developers are struggling to make projects work against rising construction costs, lower price-point targets, and lengthy processing times that make shifting locations or product types years slower than corresponding demand shifts. And this data nerd expects we won’t see much relief ‘til sometime mid next year.
This article is authored by Ben Smith, President of AVESDO: a Canadian software company harnessing the power of data to help real estate professionals make better, faster, and more informed sales decisions.
This article was produced in partnership with STOREYS Custom Studio.