After months and months of continued increases, housing prices in Metro Vancouver have dropped for the second consecutive month, according to statistics published by the Real Estate Board of Greater Vancouver (REBGV).
The composite residential benchmark price hit $1,203,300 in September, which represents a 0.4% decrease compared to the $1,208,400 in August, which was itself a decrease from the $1,210,700 in July.
By property type, the benchmark price is now $2,017,100 for single-detached homes, $1,098,400 for townhouses, and $768,500 for condominiums, with all three representing decreases between 0.1% and 0.5% from August. All three are still increases of between 5.3% and 5.8% when compared to September 2022, however.
That easing of housing prices was the result of both a seasonal decline in sales and a modest increase in inventory, says REBGV.
In September, the Greater Vancouver region recorded a total of 1,912 home sales, which was down from the 2,283 sold in August. The September 2023 total is a significant increase compared to the 1,701 sold in September 2022, although both were well below the 10-year seasonal average of 2,614.
On the supply front, September saw 5,446 new residential listings added to the market — a fairly large improvement after 3,943 were added in August. Including that new batch of listings, the total number of active listings in the region is now 10,810.
Buyers or Sellers?
Armed with the aforementioned statistics, we can identify the sales-to-new-listings ratio and sales-to-active-listings ratio, which are two quantitative indicators that can give us a sense of whether the market is currently favouring buyers or sellers.
For the sales-to-new-listings ratio, a ratio of 40% or lower is considered a buyers' market, a ratio of 55% or higher is considered to be a sellers' market, and anything in between is considered a balanced market.
With 1,912 home sales and 5,446 new listings recorded in September, the sales-to-new-listings ratio is now 35.1% after coming in at 57.9% in August, reflecting the significant increase in new options that likely gives buyers a leg up in the market.
For the sales-to-active-listings ratio, a ratio of 12% or lower is viewed as favouring buyers, a ratio of 20% or higher is viewed as favouring sellers, and anything in between is viewed as a balanced market.
With 1,912 home sales and 10,810 total active listings after September, the sales-to-active-listings ratio is now 17.7%, after coming in at 23.9% in August, indicating that the market is leaning towards buyers, but may currently be at a balance.
Statistics seem to also indicate a fairly big difference in the market depending on the property type. Although the sales-to-active-listings ratio is 17.7% overall, it's 12.6% for single-detached homes — essentially in buyers' market territory — and 21.6% and 21.3% for townhouses and condos, respectively — in sellers' market territory.
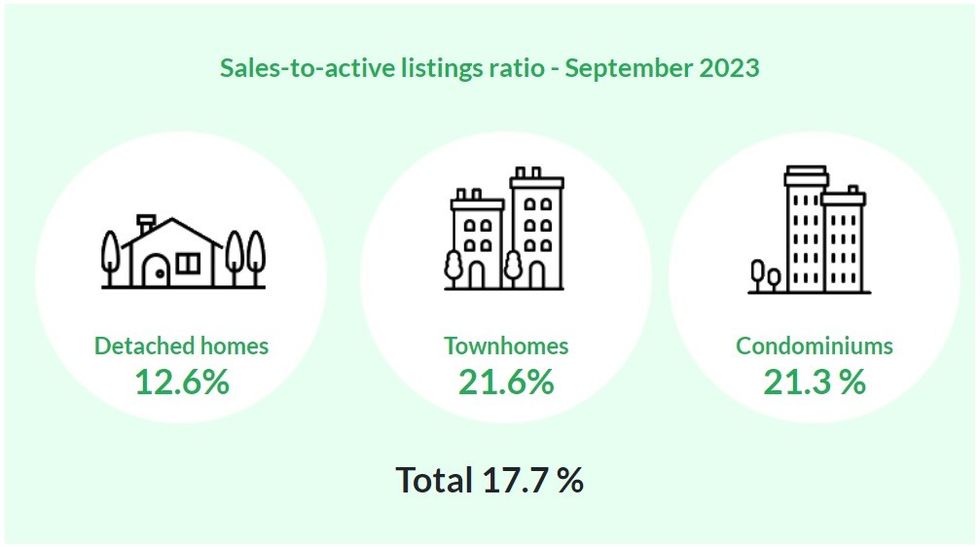 The sales-to-active-listings ratio in September.(REBGV)
Analysis
"In contrast to the spring and summer, the September data suggests there may be a renewed interest on the part of sellers to participate in the market, with new listing activity rising back in line with long-term historical averages," says REBGV's Director of Economics and Data Analytics Andrew Lis. "This upward shift in new listings has allowed overall inventory levels to recover modestly from the low levels we saw earlier this year. When we pair this dynamic with the slowdown in sales that typically occurs in the fall as a result of seasonal patterns, the outcome is more balanced market conditions overall."
Lis also adds that a key dynamic that has been present throughout the year is the reluctance many homeowners have shown to list their homes, which has resulted in fewer listings entering the market in the early part of the year, subsequently resulting in price increases throughout the spring and summer.
Zooming in further, housing prices are up in every submarket of Greater Vancouver over the past six months, from anywhere between 2.1% (Sunshine Coast) to 10.8% (Ladner).
On a year-over-year basis, housing prices are up in all submarkets except the Sunshine Coast (-3.2%), Whistler (-1.7%), West Vancouver (-1.5%), Port Moody (-1.1%), and Bowen Island (-0.7%).
By property type, the Sunshine Coast is currently the only submarket in the region where the benchmark price for a single-detached home is below $1M — at $903,500, with the next lowest being Maple Ridge at $1,297,200.
For townhouses, benchmark prices are below $1M in Burnaby East, Burnaby North, Maple Ridge, New Westminster, Pitt Meadows, Port Coquitlam, and the Sunshine Coast.
And, finally, for condos, only West Vancouver has a benchmark price over $1M — at $1,331,600 — while Maple Ridge sports the lowest benchmark price, at $542,600.