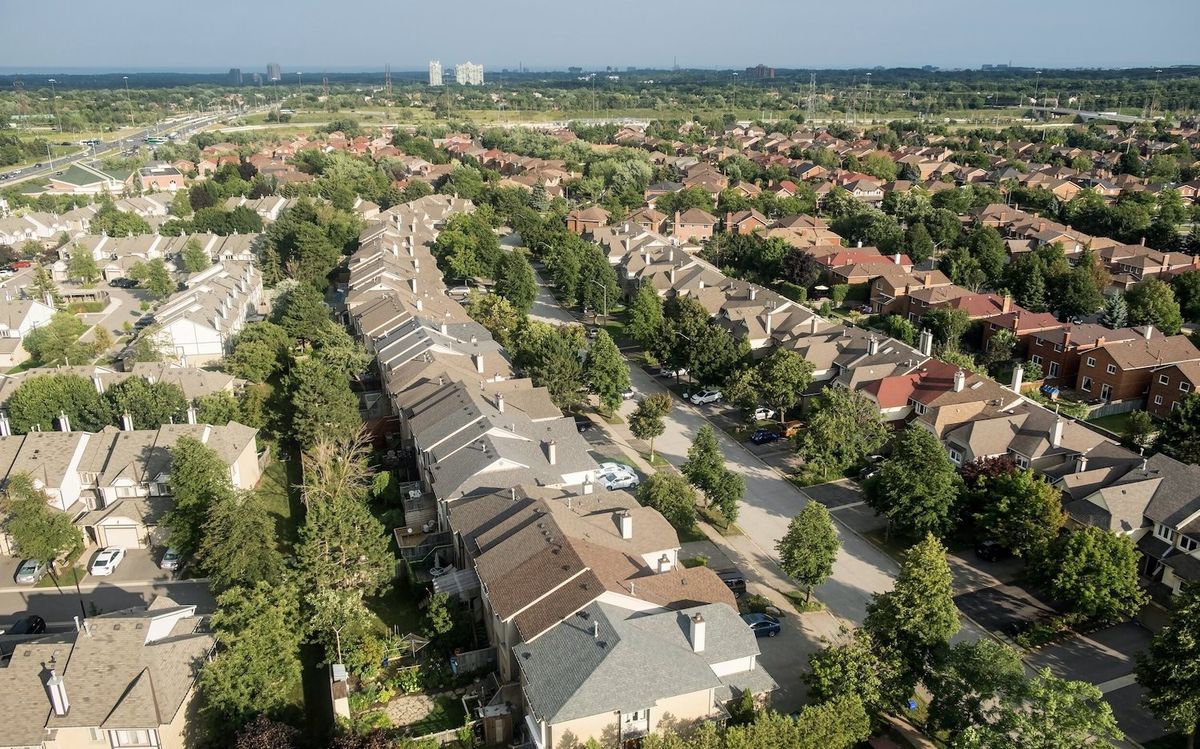
Home prices in the Greater Vancouver area continued to slip in June, new data from the Real Estate Board of Greater Vancouver (REBGV) revealed, falling 2% from May prices.
The MLS Home Price Index composite benchmark price for all residential properties in Metro Vancouver fell to $1,235,900 in June. Although also a 2.2% decrease over the past three months, the price is still up 12.4% annually.
The biggest month-over-month change was seen in Port Coquitlam where prices fell 4.1%. It was closely followed by Coquitlam and Maple Ridge, both of which saw 3.9% drops in home prices from May.
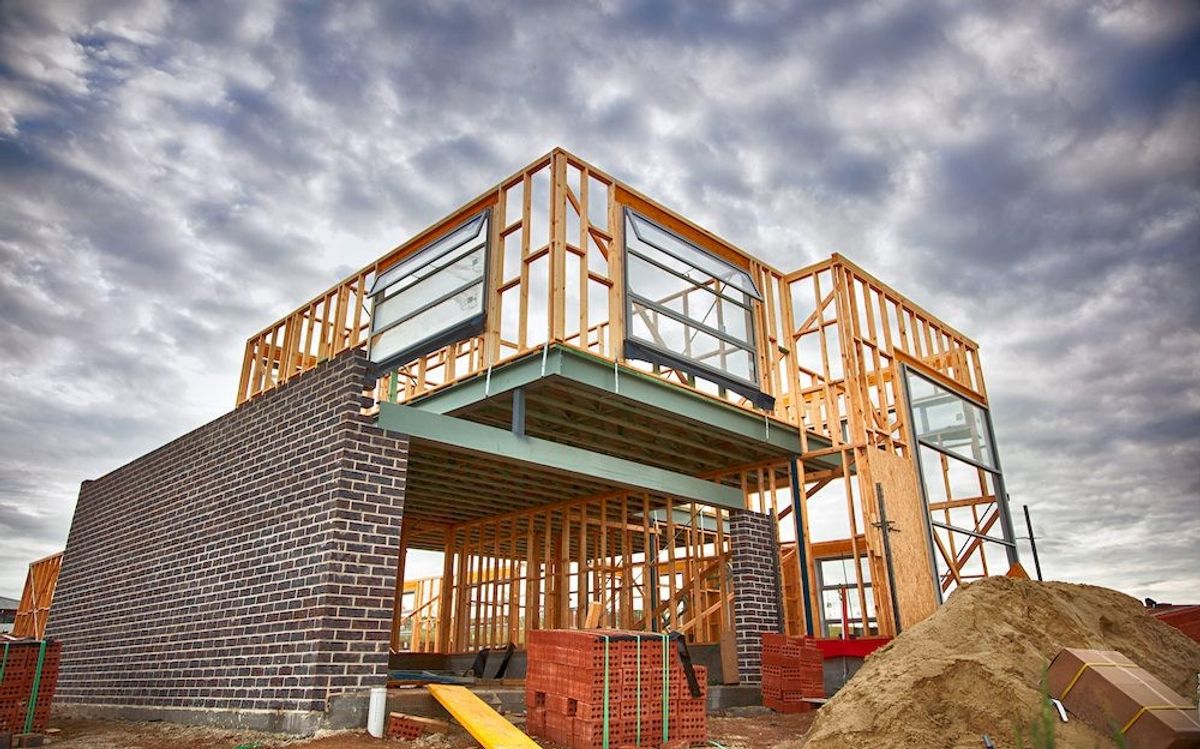
“We’re seeing downward pressure on home prices as we enter summer in Metro Vancouver due to declining home buyer activity, not increased supply,” said REBGV Chair Daniel John. “To meet Metro Vancouver’s long-term housing demands, we still need to significantly increase housing supply.”
Indeed, home sales plummeted in June, totalling just 2,444 -- a 35% decrease from June 2021 and a 16.2% drop from just one month prior. Detached home sales saw the biggest change, falling 48.3% year over year. Attached home sales were down 36% annually, and apartment sales down a slightly more modest 25.3%.
At the same time, new listings are also down, falling 17.6% from May to June to a new total of 5,256. This is also a 10.1% decrease from the same time last year. But when looking at the total number of homes currently listed on the Metro Vancouver MLS, it's up 4.1% from May.
"Home buyers have more selection to choose from and more time to make decisions than they did over the past year," John said. "Rising interest rates and inflationary concerns are making buyers more cautious in today’s housing market, which is allowing listings to accumulate."
Although prices have slipped, Metro Vancouver is nowhere near a buyer's market yet. Typically a sustained sales-to-active-listings ratio below 12% will put downward pressure on home prices meanwhile a ratio above 20% will exert upward price pressure. In June, the sales-to-active-listings ratio sat at 23.4% -- well within the upward pressure range.
When looking at individual property types, the ratios plays out differently. For townhomes and apartments it's 31.5% and 30.2%, respectively. But for detached homes, it's a much lower 14.3% -- noticeably closer to the downward pressure range.