The Metro Vancouver housing market showed more signs of life in February, according to new data from the Real Estate Board of Greater Vancouver (REBGV), with activity picking up from the hard-to-beat lows of January.
In February, REBGV registered a total of 1,808 home sales, which is a solid 76.9% increase compared to the 1,022 sold in January, but is notably 47.2% below February 2022 sales numbers, and 33% below the 10-year average for February.
February also saw 3,467 new listings, which was again an increase over January (5.2%), but a decrease compared to February 2022 (-36.6%), which saw 5,471 new listings.
The number of total listings in Metro Vancouver inched up to 7,868, a 5.2% increase compared to the 7,478 in January, as well as a 16.7% increase compared to the 6,742 in February 2022.
"February listing data show a continued reluctance among prospective home sellers to engage in Metro Vancouver's housing market, leading to below-average sales activity," REBGV said. "It's hard to sell what you don't have," added REBGV Director of Economics and Data Analytics Andrew Lis.
The Market Lean
For those who do want to engage with the housing market in Metro Vancouver, or are at least considering it, is this a better time to be a buyer or seller?
Using the aforementioned statistics, we can determine the sales-to-active listings ratio, which serves as a quantitative indicator of whether the market is leaning towards buyers or sellers. The market is viewed as favoring buyers when the ratio is below 12%, favoring sellers when it is above 20%, and considered balance when in between.
With 1,808 sales in February and 7,868 active listings, the sales-to-active-listings ratio is now 22.9%. After the ratio was at just 13.7% in January, this is likely a sign that the market is now favoring sellers.
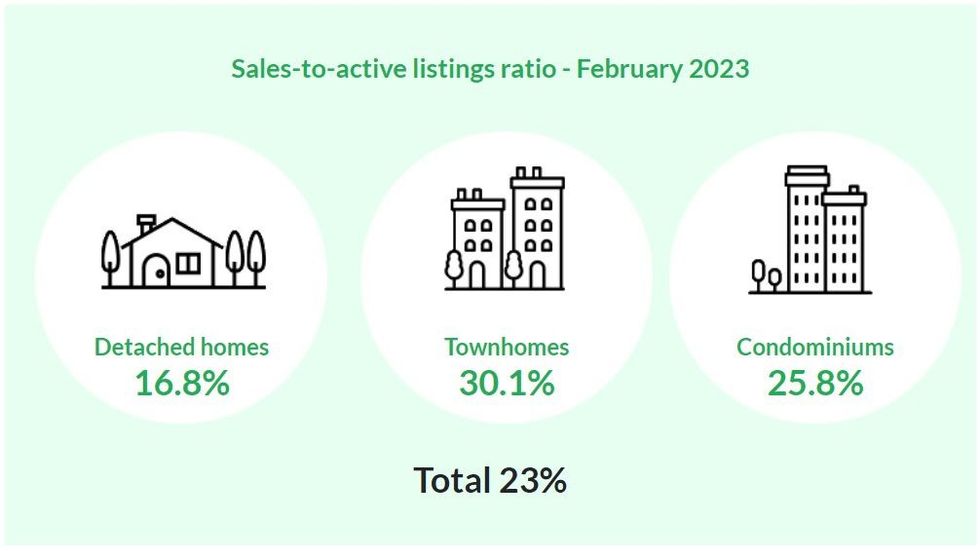
Diving a bit deeper, the sales-to-active listings ratio was drastically different across the three residential property types. Single-detached homes had a ratio of 16.8%, while condominiums had a ratio of 25.8% and townhouses had a ratio of 30.1%, indicating that it's better to be a seller in the condominium and townhouse market now than it is in the single-detached home market.
One other quantitative indicator of the market lean is the sales-to-new-listings ratio, where a ratio below 40% is considered a buyers' market, 55% or higher as a sellers' market, and a ratio in between viewed as a balanced market.
With 1,808 overall home sales and 3,467 new listings in Greater Vancouver in February, the sales-to-new-listings ratio is 52.1%. In January, that ratio was 30.9%, confirming movement towards sellers.
"For prospective buyers, the below-average sales activity is allowing inventory to accumulate, which is keeping market conditions from straying too deeply into sellers' market territory, particularly in the more affordably-priced segments," Lis said.
READ: Metro Vancouver Home Sales May Dip In 2023, But Prices Will Still Rise
Prices Are Firming Up
The composite residential benchmark price in Metro Vancouver is now at $1,123,400 -- 9.3% lower than the benchmark price in February 2022, but a 1.1% increased when compared to January 2023.
"While we continue to expect home price trends to show year-over-year declines for a few more months, current data and market activity suggest pricing is firming up," added Lis.
By property type, the benchmark price is now $1,813,100 for single-detached homes, $1,038,500 for townhouses, and $732,200 for condominiums. All three represent decreases compared to this time last year, but are slight increases -- 0.7%, 1.8%, and 1.6%, respectively -- over January.
Including all residential types, the benchmark price in every sub-area of Greater Vancouver saw a year-over-year decrease, with Pitt Meadows and Maple Ridge seeing the steepest declines, at 19.5% and 19.0%. On the other end of the spectrum, Richmond saw the smallest decline in the past year, with the composite benchmark price dropping only 4.0%.
