Equity Take-Out
Learn what an equity take-out is in Canadian real estate, how it works, and how homeowners use it to borrow against property value for cash.

May 22, 2025
What is an Equity Take-Out?
An equity take-out is a financial strategy in which a homeowner borrows against the built-up equity in their property, often by refinancing or securing a home equity loan.
Why an Equity Take-Out Matters in Real Estate
In Canadian real estate, equity take-outs are used to access cash for renovations, investments, education, or debt consolidation.
Common equity take-out methods include:- Refinancing the mortgage
- Applying for a Home Equity Line of Credit (HELOC)
- Obtaining a second mortgage
Lenders calculate the maximum amount that can be borrowed based on the property's current market value and outstanding mortgage balance. Most institutions allow borrowing up to 80% of the property’s appraised value.
Understanding equity take-outs helps homeowners unlock capital from their property without selling, while managing risks and repayment responsibilities.
Example of an Equity Take-Out in Action
A homeowner with $300,000 in equity refinances their mortgage to take out $75,000 for a major renovation project.
Key Takeaways
- Accesses property equity as cash.
- Used for major purchases or debt repayment.
- Often involves refinancing or HELOCs.
- Subject to appraisal and lender limits.
- Increases overall mortgage balance.
Related Terms
- Home Equity
- Refinance
- HELOC
- Loan-to-Value Ratio (LTV)
- Second Mortgage

 The Mason Suite Interior (Infinity Properties)
 The Mason Suite Interior (Infinity Properties)
 Rail District aerial (Infinity Properties)
 Versant (Infinity Properties)








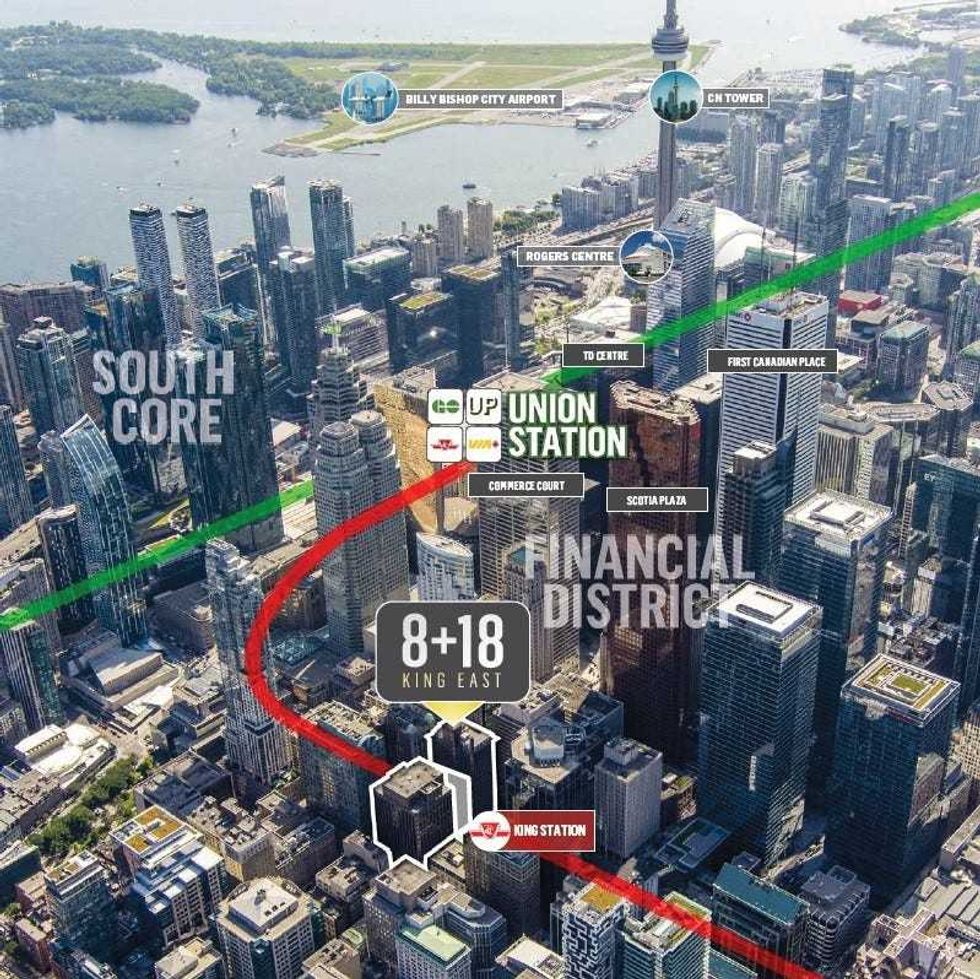 8 and 18 King Street East in Toronto. (RBC Capital Markets Realty)
 Interior photos of 8 and 18 King Street East. (RBC Capital Markets Realty)


 Narrow Fourplex (City of Toronto)
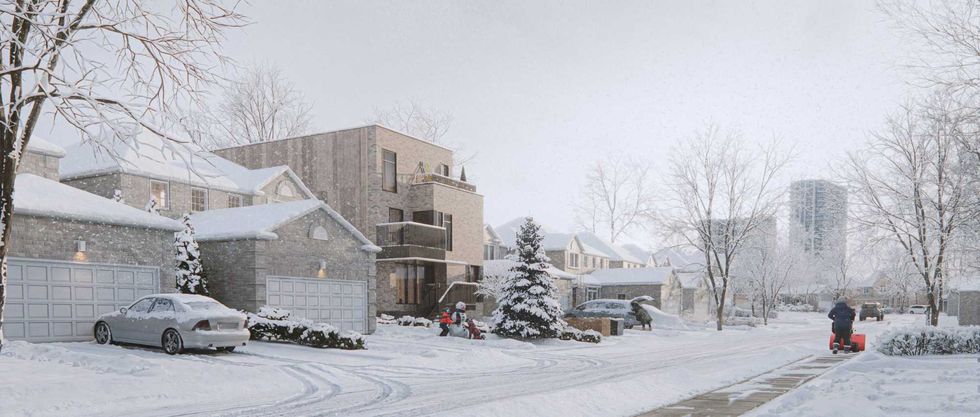 Wide Sixplex - Side View (City of Toronto)