
The persistent narrative that a lack of supply is the culprit behind Canada’s housing crisis has been driven home by everyone from politicians to real estate experts and developers (and, admittedly, the media).
In talks of the country’s supply crunch, the common statistic referenced -- and sentence spoken -- is that “Canada has the lowest supply of housing in the G7.” But this metric needs to be approached with caution, according to BMO’s Chief Economist, Douglas Porter. He says other factors need to be given as much air time.
In an April 12 daily chart deck, Porter highlighted data from the Federal Budget 2022, sourced from the Organisation for Economic Co-operation and Development (OECD,) that clearly displays the average number of homes per capita in France, Germany, Japan, the United Kingdom (UK), Canada, United States (U.S.), Australia, and New Zealand.
As Porter highlights, Canada is not in fact particularly out of line with the OECD average on the supply front. In fact, it appears quite comparable to the U.S., UK, and Australia. “And we have made the point many times that given a younger population than Europe or Japan, we would naturally have a younger ratio -- kids don’t own homes,” writes Porter.
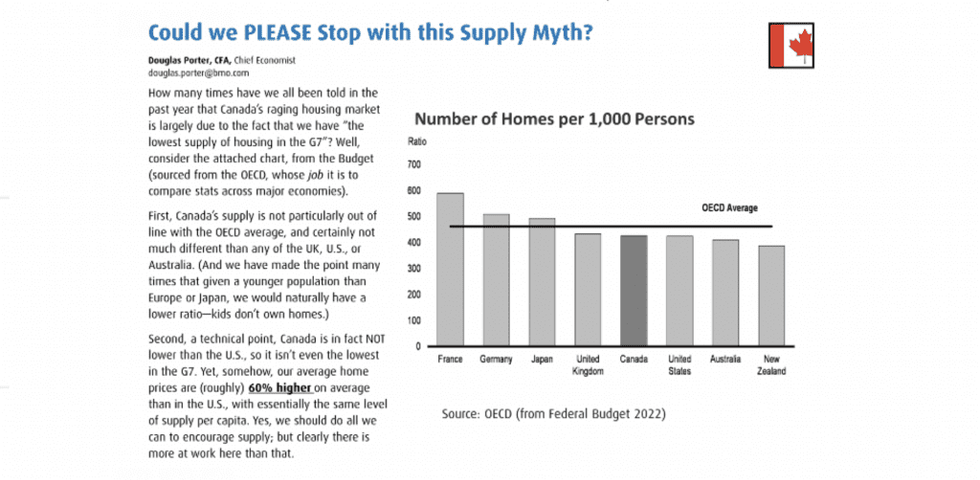
He highlights that -- contrary to the popular narrative -- Canada is not in fact lower than the U.S. on the supply per capita front, so the country is not even the much-touted lowest in the G7. “Yet, somehow, our home prices are (roughly) 60% higher on average than in the U.S., with essentially the same level of supply per capita,” writes Porter. “Yes, we should do all we can to encourage supply; but clearly there is more at work here than that.”
It didn’t take long for commentary to make its way to Twitter. “Doug Porter is officially on the developer hit list,” tweeted Vancouver realtor and housing analyst Steve Saretsky, with an accompanying screen shot of the report. As for the ensuing comments, they were inevitably divided -- but many passionate Twitter users seemed to agree that there were other pieces to the housing crisis equation than the supply narrative.
“There’s definitely some information there; but it’s an imperfect measure,” said Porter of the supply per capita measure on a call with STOREYS. “We shouldn’t be hanging our hat entirely on this one measure.”
To be clear, Porter isn’t suggesting that the country is free of a supply issue.
“I think I’m being quoted as saying the whole supply shortage issue was a myth; I didn’t mean to suggest the entire issue is a myth,” says Porter. “I just don’t think we should rely so heavily on this particular metric. The more relevant measure is the number of housing units per adult, not per person. If you have a younger economy with more kids, it stands to reason that you’ll have fewer units per person, because kids don’t own homes -- at least, not the ones I know.”
Porter also points to sweeping regional differences across the country. “Averages like this for the nation tend to hide as much as they tell you,” he says. “For instance, there’s a massive difference between Ontario and Newfoundland. But even if you have that information, it doesn’t tell you everything. As another regional example; there are fewer units of housing per person in Manitoba than in BC, but -- according to this metric -- that wouldn’t suggest that BC has a tighter, hotter, and pricier market, which it clearly does.”
So, while Porter acknowledges there is some relevant information in this widely used metric, he suggests you have to treat it with care and a critical eye.
“Even based on the OECD data, Canada isn’t some strange outlier,” he says. “We’re similar to many countries you’d think we’d be in terms of supply of homes per person -- U.S., Britain, and Australia.”
 Living homes in Canada
Many Factors Need to Be Considered
So, the question is, what would be a better metric?
“This supply per person is one measure; but there are many factors that need to be considered, including vacancy rates,” says Porter. “Frankly -- there again -- our vacancy numbers don’t suggest anything strangely out of the ordinary either. Housing is certainly tight in some cities, but nationally -- including in Toronto -- the vacancy rate isn’t exceptionally low. It actually got down to near zero in the mid-1980s and we’re above that now. Of course, Toronto in the 1980s was an extremely hot market, so I am not suggesting that is a healthy place to be; but an example of an extremely supply constrained market.”
Given the fact that Canada’s population keeps growing so quickly, supply shouldn’t be an overlooked issue, reiterates Porter.
“We do need a steady stream of new supply,” says Porter. “Certainly, in some cities, I don’t deny that supply is tight. I just don’t believe that it’s the overwhelming issue that some make it out to be. Nor is it something that can be fixed overnight; it takes years to adjust the supply. So, if you know you’ve got a relatively tight supply, then you need to act on the demand side so you don’t get a rollicking boom in demand, which is essentially what we’ve seen in the past two years.”
Citing “two blades to these scissors” Porter then says we need to look at both supply and demand for solutions to tame the housing market. “But focusing on demand policies impacts the market more quickly, and -- I would argue -- more effectively. Certainly, we should focus on doing what we can to improve and encourage supply, but it realistically takes years and demand can shift in minutes,” he says.
Enter increasing interest rates -- something some say came too late. Yesterday, the Bank of Canada (BoC) announced it is increasing its Overnight Lending Rate by a half point, bringing it to a full 1% in the largest rate hike seen since May 2000.
“I think interest rates are the number one tool in the toolkit to help contain demand. Yesterday’s rate will set us on a more appropriate path and is likely the second of many rate increases we’ll see this year and possibly in 2023 as well,” says Porter. “I think that’s going to change the story in the housing market relatively quickly. By all accounts, conditions are changing rapidly in a number of cities.”
 Ottawa, Canada, September 6, 2020; The English version of the sign on the Bank of Canada headquarters on Wellington Street
U.S. prices have risen more in the past year than they did in the housing bubble in mid 2000s. Yet, they’re not the same as Canada’s record-breaking home costs.
“You need to be extremely careful comparing averages,” says Porter. “But if you adjust for the exchange rate and you look at average prices between the two countries, Canada’s average home prices are almost 60% higher than they are in the U.S. with roughly a comparable level of units per person. So, that tells me that the units per person measure isn’t that useful. How does it explain such a massive gap in average prices between the countries?”
So, what does explain the dramatic gap?
“I don’t think there’s a simple and easy explanation behind the gap; it’s something we’ve looked at for years,” says Porter. “But part of it may be the very favourable tax treatment in Canada that encourages more investment in the sector.”
While Canada has made some strides to tackle demand, the relentless supply focus is alive and well. One just needs to look at the supply side-heavy Federal Budget 2022 to determine that.