Demand has been steadily returning to the Greater Toronto Area housing market following last year’s stress-test-induced slump, and July was no exception; sales were up 24.3 per cent across the region, reports the Toronto Real Estate Board, pulling up the average home price and cranking up the heat on buyers.
READ: Infographic Reveals The Hottest Sellers’ Markets In Canada
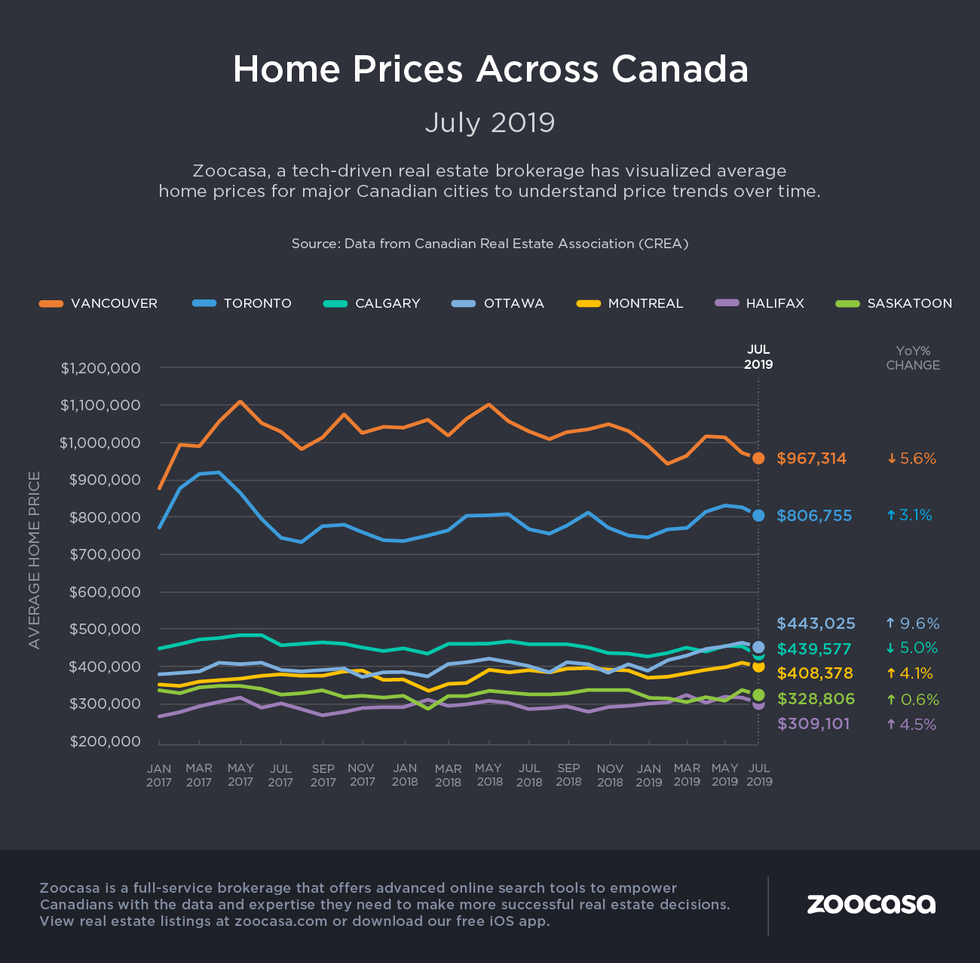
Last month’s numbers reveal a total of 8,595 homes changed hands, well outpacing a 3.7 per cent increase in new listings. That’s pushed the sales-to-new-listings ratio – a measure of competition within a given housing market – to 59 per cent in the GTA, just on the edge of sellers’-friendly territory. This means buyers are more likely to encounter bidding wars and other high-pressure market phenomenons as supply struggles to satiate demand. As a result, the average home price rose by 3.2 per cent to $806,755.
Supply And Demand A Creeping Issue
TREB’s analysts say this growing supply and demand imbalance is a key concern, as sustained sellers’ conditions over the longterm could return the market to unsustainable price growth; the trend that prompted the provincial and federal governments to step in with market-cooling regulations in mid 2017 and 2018. Indeed, today’s buyers appear to have absorbed and recovered from any resulting hit to their affordability, and are returning to the market in droves.
READ: OREA Calls Stress Test ‘Disastrously Flawed,’ Urges Policy Be Changed
“While the OSFI mortgage stress test has clearly had an impact on the number of home sales over the last year and a half, for most GTA residents the goal of homeownership has not diminished,” stated John DiMichele, TREB’s CEO. “In fact, we’re seeing growing pent-up demand for ownership housing, especially as the number of GTA households continues to increase by 40,000 to 50,000 due to strong population growth.”
Suburban Markets See Strongest Growth
While the City of Toronto had a strong month (sales were up 20.8 per cent with average condo and sold house prices in Toronto increasing 2.89 per cent to $839,943), the hottest activity occurred in the 905 markets. These areas as a whole saw sales rise 25 per cent, while the average price rose four per cent to $787,937.
Municipalities with comparably affordable prices saw the greatest increase in demand; Oshawa houses for sale, which come at an average price of $501,187 rose 35 per cent, while demand for Milton homes for sale rose 15 per cent, reflecting an average sale price of $741,077.
READ: Toronto House Prices Are On The Rise As The Market Rebounds
Meanwhile, sales were up 15.6 per cent in Mississauga and 28 per cent in Brampton, with average home prices clocking in at $764,463 (+8 per cent) and $736,401 (+4 per cent), respectively. In contrast, homes in higher-priced York region saw prices edge up just 0.7 per cent to $930,577, despite a hefty 33 per cent uptick in transactions.
Lower Price Points In Highest Demand
Demand for the most affordable home types also doesn’t appear to be letting up, as the craze for condos remains evident – the MLS Home Price Index rose 4.4 per cent based on an uptick in sales and prices growth for apartment, townhome, and semi-detached homes, while detached home prices lagged behind in many markets throughout the region.
READ: GTA Condo Sales Soar As Toronto Has Lowest 2nd Quarter Since 2009
“Broadly speaking, increased competition between buyers of available properties has resulted in relatively strong price growth above the rate of inflation for semi-detached houses, townhouses, and condominium apartments,” stated Jason Mercer, TREB’s chief market analyst.
“However, the single-detached market segment, which has arguably been impacted most by the OSFI stress test, has experienced a slower pace of price growth.”
Check out the infographic below to see how sales and price trends have changed year over year in the City of Toronto in July:
