GTA property taxes are taxing, both financially and mentally — especially for home buyers these days.
While affordability and mortgage costs are typically top of mind for home buyers, property taxes can be a significant carrying cost that's often overlooked.
How much property tax will you need to pay each year?
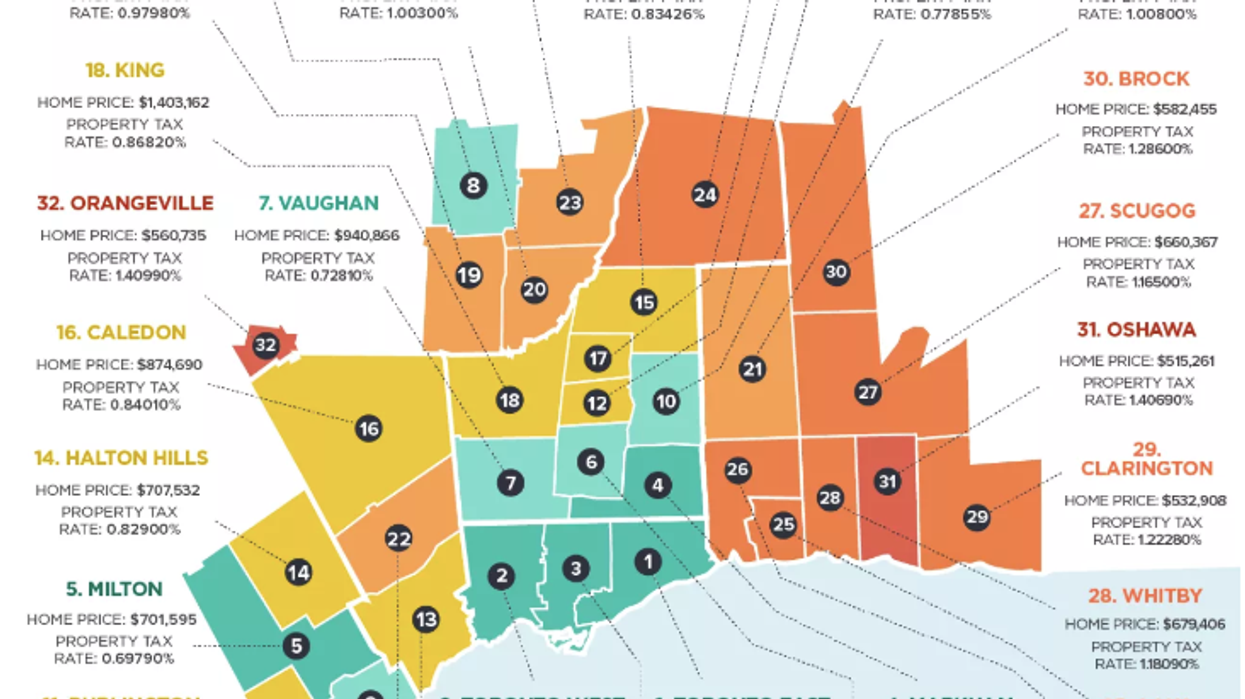
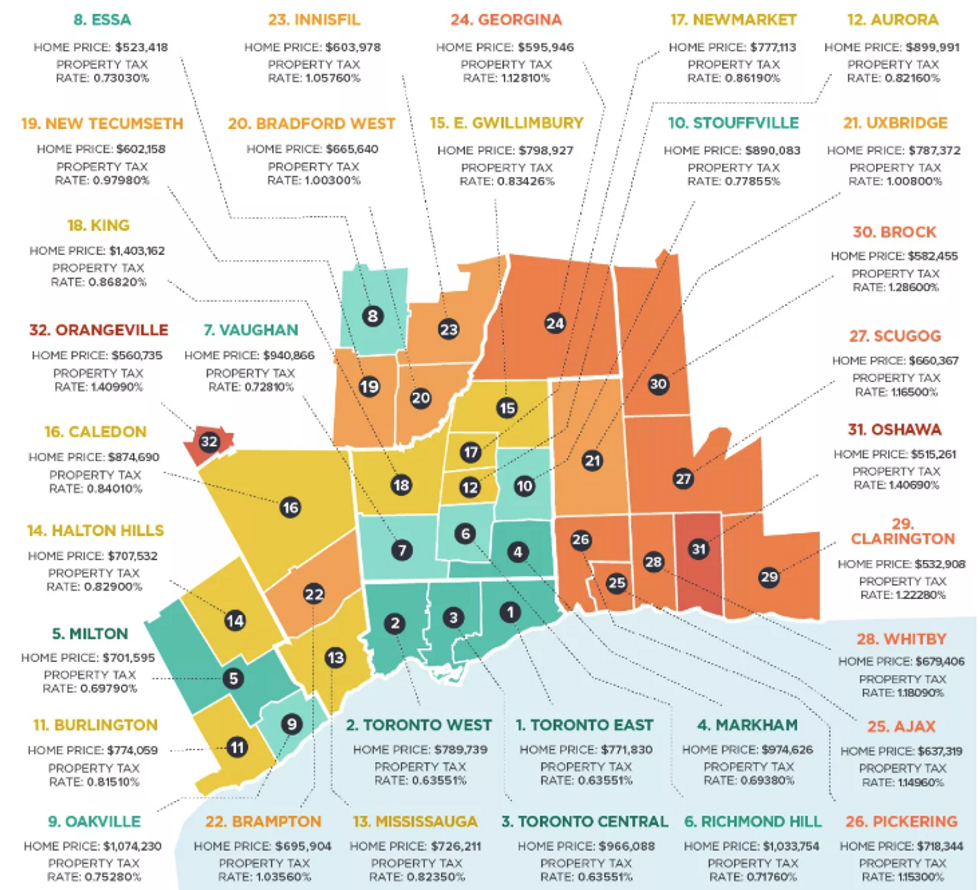
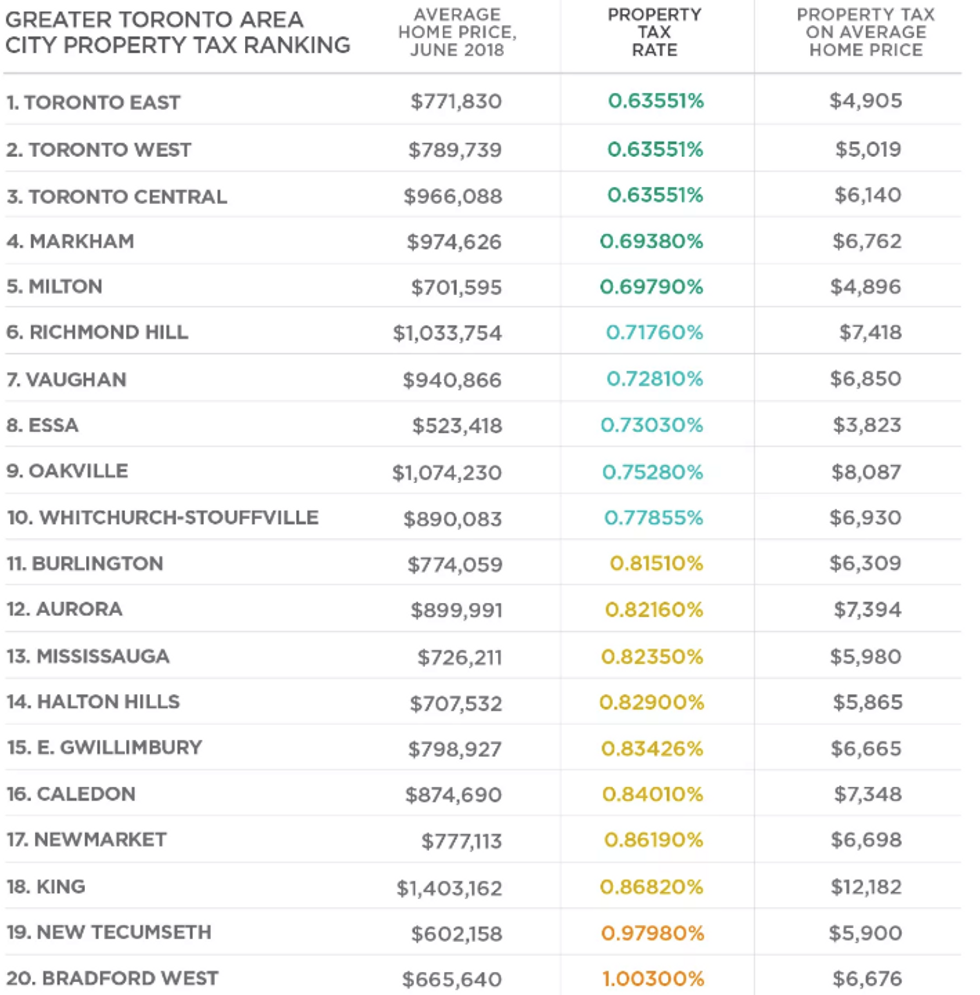
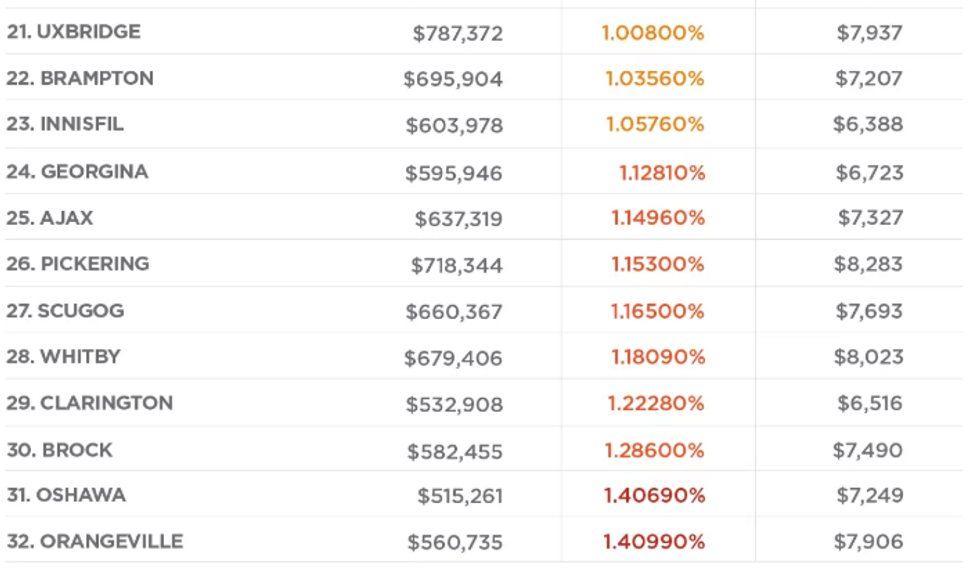
The property tax rate varies wildly depending on what Greater Toronto Area city you live in. It ranges from the lowest in the City of Toronto at 0.63551 per cent, to the highest in Orangeville at 1.40990 per cent.
READ: How Much You Need To Earn To Afford A Home In These GTA Cities
Cities with the highest home values, such as the City of Toronto, Markham and Richmond Hill, tend to have the lowest property tax rates.
Conversely, cities such as Oshawa and Orangeville with the lowest average home values, have some of the highest tax rates.
For example, Oshawa, the most affordable GTA city, where the average home price is $515,261, has the second highest property tax rate of 1.40690 per cent. This results in annual taxes of $7,249.
Meanwhile, the average Richmond Hill home is worth twice as much at $1,033,754. But the owner pays about the same amount in property taxes at $7,418 because the tax rate is substantially lower at only 0.71760 per cent.
To find out how property tax rates differ in each GTA city, Zoocasa collected property tax rates for each area and calculated the amount paid based on the average home price in June 2018:
GTA Cities With Lowest Property Tax Rates
1. Toronto - 0.6355054% ($5,532 taxes based on $870,559 average June 2018 home price)
2. Markham - 0.6938% ($6,762 taxes based on $974,626 average June 2018 home price)
3. Milton - 0.6979% ($4,896 taxes based on $701,595 average June 2018 home price)
4. Richmond Hill - 0.7176% ($7,418 based on $1,033,754 average June 2018 home price)
5. Vaughan - 0.7281% ($6,850 based on $940,866 average June 2018 home price)
GTA Cities With Highest Property Tax Rates
1. Orangeville - 1.4099% ($7,906 taxes based on $560,735 average June 2018 home price)
2. Oshawa - 1.4069% ($7,249 taxes based on $515,261 average June 2018home price)
3. Brock - 1.2860% ($7,490 taxes based on $582,455 average June 2018 home price)
4. Clarington - 1.2228% ($6,516 taxes based on $532,908 average June 2018home price)
5. Whitby - 1.18090% ($8,023 taxes based on $679,406 average June 2018 home price)

