The gap between the rich and the poor widened at the fastest pace on record at the beginning of the year, as the rising cost of living and a decline in real estate values weighed on the wealth of vulnerable households.
According to new data from Statistics Canada, the gap in net worth between the wealthiest households -- the top 20% -- and the least wealthy -- the bottom 40% -- increased by 1.1% in Q1 2023 relative to Q1 2022, the fastest jump on record. However, at 65.1%, the measure remained 0.5% below Q1 2020.
Canada's wealthiest households account for 67.8% of the country's net worth, while the least wealthy account for just 2.7%. Recent economic pressures have had "unprecedented impacts" on the latter group; their net worth decreased by 13.8% annually in Q1, while the former saw their net worth fall 3.8%.
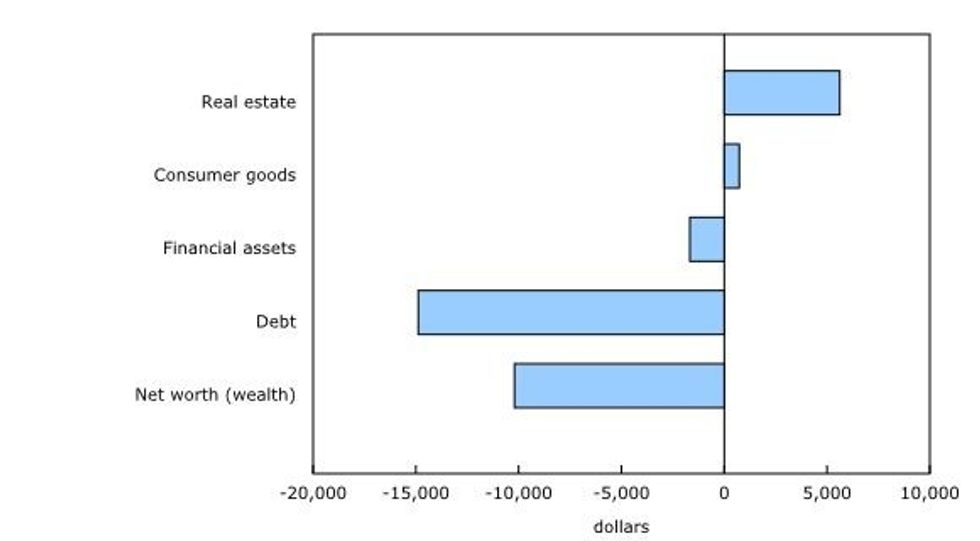
Across all households, the reduction in net worth was due almost entirely to real estate, which accounted for 92.1% of losses. The average value of real estate held by Canadian households dropped 8.6% annually in Q1, as the national average home price fell 13.7% over the same time period to $686K.
Amongst the least wealthy households (the bottom 40%) the decline was largely due to the increase in mortgage debt outweighing the increase in the average value of real estate holdings -- the figures rose 23.8% and 6.2%, respectively, on an annual basis in Q1 2023. Over the same period, their non-mortgage debt grew by 4.6%.
Meanwhile, the top 20% reduced their mortgage debt by 0.9% year over year in Q1 2023. Declines in the wealthiest households' average net worth were due entirely to reductions in real estate, at 9.8%. StatCan noted, though, that the income group were less engaged in the market over the last year.
Younger age groups saw the largest drop in their net with in Q1 2023. Households under the age of 35 experienced an 8.7% annual decline, while those aged 55 to 64 years saw their net worth fall 1.8%.
According to StatCan, younger Canadians derive more of their net worth from real estate, and are therefore more susceptible to reductions in the asset class. In Q1 2023, real estate accounted for 88.3% of wealth for households under 35 years, and 40.1% for households aged 65 years and older.
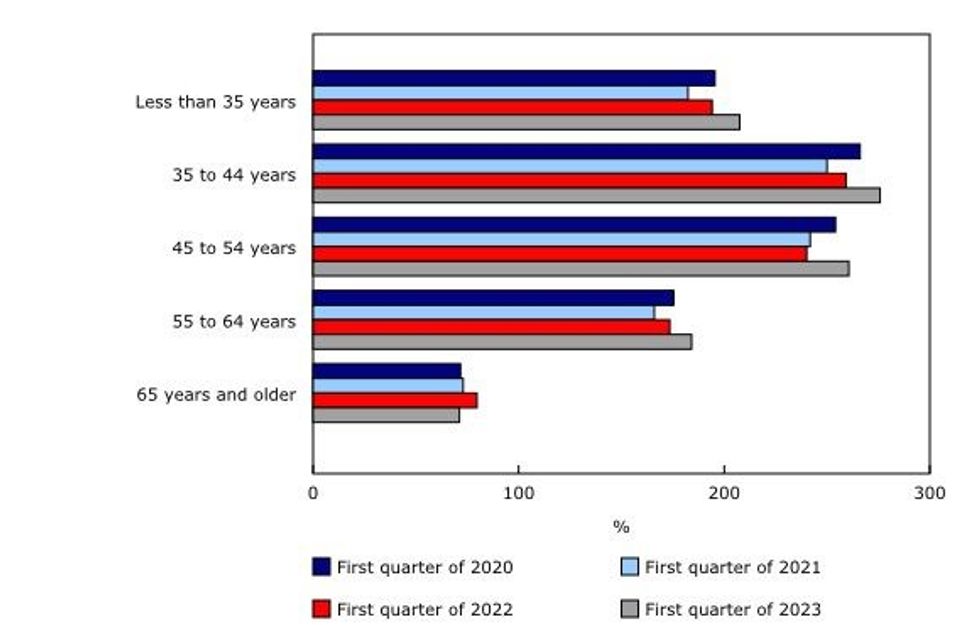
Meanwhile, debt-to-income ratios for younger and core working-age groups reached their highest rate on record in Q1.
Stubbornly high inflation and interest rates have restrained young workers' ability to make ends meet -- although their employment income has increased, the age group tends to hold higher balances on credit cards and mortgages. As such, the debt-to-income ratio for those under the age of 35 hit 207.5% in Q1, a 13.4% annual increase.
Amongst those aged 35 to 44 years, the debt-to-income ratio reached 275.8% in Q1, a 16.6% year-over-year increase. The ratio rose 20.5% annually for those aged 45 to 54 years, reaching 260.6% in Q1 2023.
"Persistently high interest rates and inflation are likely to continue to strain households' ability to make ends meet without going further into debt, especially vulnerable groups, such as those with the lowest income, the least wealth, and those of younger age groups," StatCan said.
As the gap in net worth between the rich and poor widened, so too did the gap between their disposable income. The difference in the share of disposable income between households in the top 40% and bottom 40% reached 44.7% in Q1 2023, up 0.2% fro, Q1 2022.
Gains in the bottom 20% of income earners were largely attributable to retirement benefits, rather than an increase in wages or investments. In contrast, the top 20% of income earners saw gains from high investment earnings and self-employment.
With the exception of the highest income earners, net savings in Q1 2023 dropped below levels seen at the start of the pandemic, as the rising cost of living outweighed income gains.
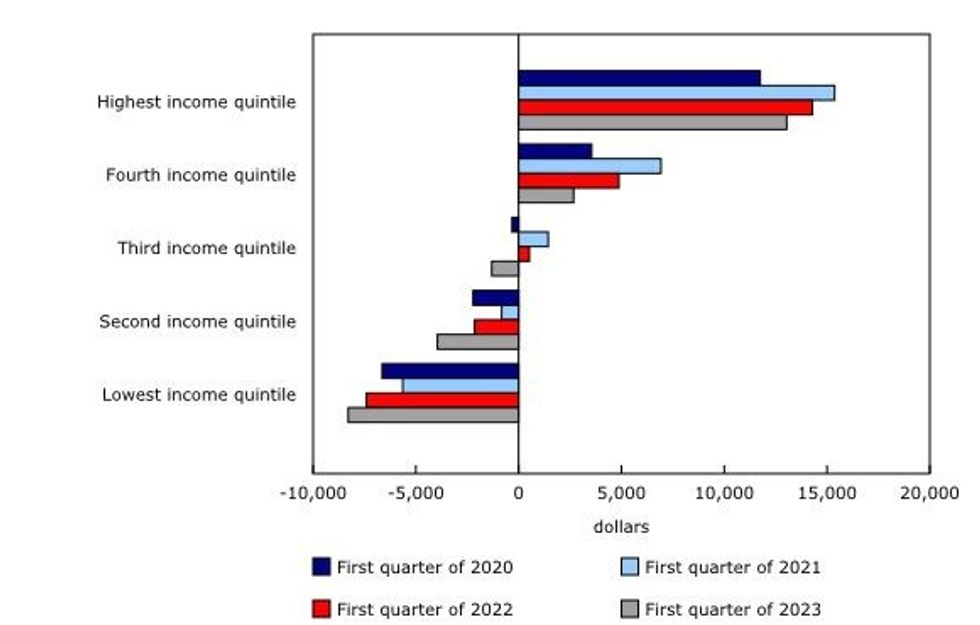
While the top 20% of households increased their net savings by $13,040 in Q1 2023, the bottom 20% saw their savings decline by $8,289.
However, inflationary pressures have weighed on middle-income earners the most -- the group saw positive net savings of $521 in Q1 2022, but spent an average of $1,306 more than they earned in Q1 2023.