As the real estate market continues to take hit after hit as a direct result of COVID-19, with both prices and sales down in the Greater Toronto Area (GTA), it's hard to imagine we'll be on the other side of the pandemic any time soon.
But, if it's any consolation, Toronto home sales finally started to see some slight improvement in the past week and real estate showings are also gradually starting to increase in Ontario, proving that there is still an underlying demand from prospective buyers, albeit at a very different level than what you might typically see in the province at this time of year.
READ: There’s Been Up to a 500% Increase in Online Virtual Home Tours in Canada
According to data from ShowingTime, a market stats and showing management technology provider for residential real estate, the initial drop in showing activity seen throughout March — as stay at home and social distancing orders were implemented — has given way to show "modest" signs of stabilization as agents are turning to virtual showings in the areas where ShowingTime operates, which includes Alberta, Ontario, and Nova Scotia in Canada, as well as many states across the US.
"Through mid-March, year-over-year showing activity was higher nationwide compared to 2019. The current volume is indicative of the industry’s response to COVID-19, which is changing daily," said the company in a statement.
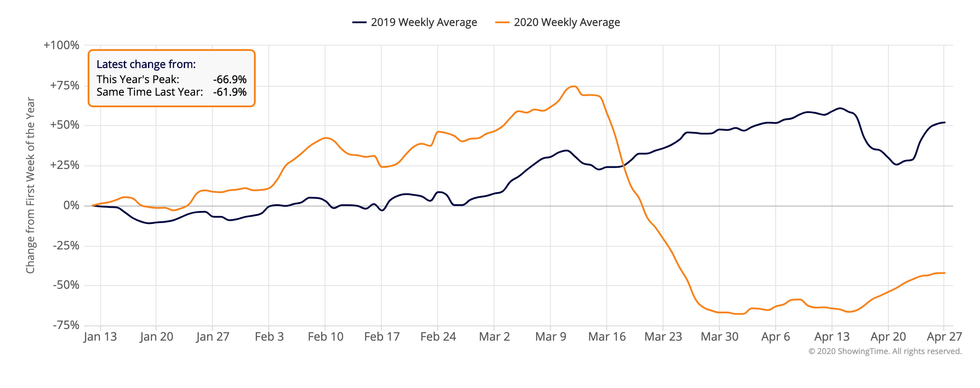
To provide daily updates charting homebuyer showing activity across the markets it serves, ShowingTime analyzes weekly real estate showing data from the first calendar week of January, through April 27, 2020, with a 7-day moving average.
Here in Ontario, you can see showing activity had been gradually increasing since the start of the year up until around March 16, when COVID-19 emergency orders were implemented and real estate showings were halted, before plunging on March 30 to the lowest weekly average of the year at -65.7%. However, as we eased into the new month, showings started to slowly pick up, before seeing a significant increase leading up to April 27 to reach a weekly average of -42.2%, nearly a 25% uptick from its lowest point.

While the showing activity shift might be minor, it's definitely an indicator that buyers and sellers are still interested in making transactions happen – pandemic or not.
The data points represent a rolling weekly average in ShowingTime’s 100 top markets, with each market recording tens of thousands of appointments in 2019 and 2020.


