Things are looking up for the autumn housing market, with stronger sales and price growth posted throughout the Greater Toronto Area last month. The latest numbers from the Toronto Real Estate Board reveal a total of 7,492 homes sold in October. An increase of 6 per cent, while prices rose 3.5 per cent, to an average of $807,340. The MLS Home Price Index, which measures the overall value of homes sold, also rose 2.6 per cent, mainly fueled by activity in the condo sector.
READ: Young Canadian Families Still Dream About Buying Single Family Homes
Activity was strong throughout the City of Toronto, with annual activity up 5.8 per cent at 3,031 homes sold, and prices rising 6.1 per cent to $869,870.
Buyers Returning to Market After Policy Changes
Such improvements could point to stabilization in the overall housing market, as buyers grapple with the outcomes of last year’s Fair Housing Plan—a set of provincial policies that effectively cooled sales and price growth—as well as the mortgage stress test, which has made it tougher to qualify for home financing.
READ: Bank Of Canada Hikes Interest Rate To 1.75 Per Cent In October Announcement
“Annual sales growth has been positive since the late spring. While the OSFI stress test and higher borrowing costs have kept sales below 2016’s record pace, many households in the Greater Toronto Area remain upbeat on homeownership as a quality long-term investment,” said Garry Bhaura, TREB president. “A strong regional economy and steady population growth will continue to support housing ownership as we move into 2019.”
Tighter Supply Puts Pressure on Buyers
There are also fewer available homes for sale, which is, in turn, putting pressure on buyers and fueling competition, especially in the most popular markets. Newly-listed homes clocked in at a total of 14,431, a decline of 2.7 per cent from last year. Combined with the increase in sales across the GTA, this has resulted in a sales-to-new-listings ratio of 51 per cent of the region—firmly balanced, but leaning slightly more toward sellers’ territory.
READ: Vancouver Home Sales Fall Again, What Does This Mean For Toronto?
This ratio, which is calculated by dividing the number of sales by new listings, provides insight into the level of competition within a market; a ratio between 40 and 60 per cent indicates balance, with below and above that threshold meaning buyers’ and sellers’ markets, respectively.
That conditions are tightening back up is a point of concern for TREB’s Director of Market Analysis Jason Mercer, who stated, “Annual sales growth has outstripped annual growth in new listings for the last five months, underpinning the fact that listings supply remains an issue in the Greater Toronto Area. With municipal elections in the rear view mirror, all levels of government need to concentrate on policies that could remove impediments to a better-supplied housing market, including facilitating the development of a broader array of medium-density housing choices.”
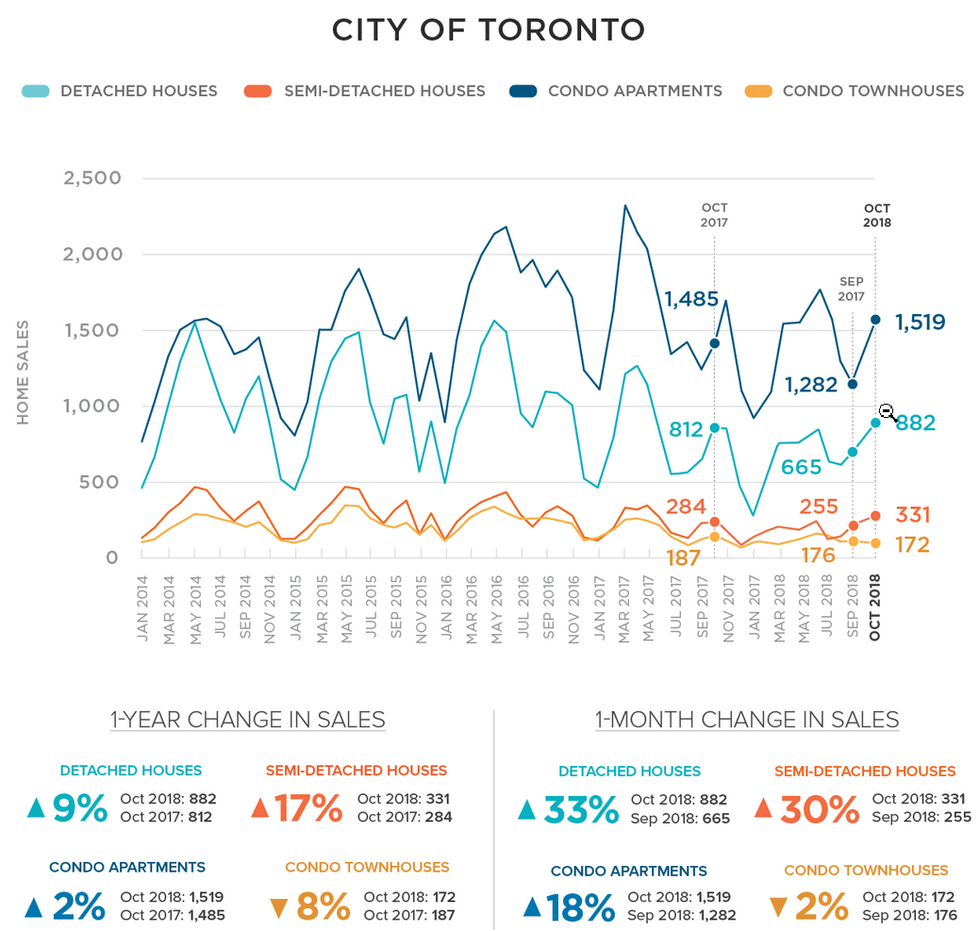
Sales by Home Type
Check out how October 2018 home prices have performed, both on a year-over-year and month-over-month basis, in the infographic below: